A Guide to the SORA Geography Calculator
When you're planning a drone flight, especially under the Specific category, one of the first things you have to nail down is the risk to people on the ground. This is where the SORA geography calculator comes in. It's an essential tool built into platforms like Dronedesk that takes the guesswork out of assessing your operational area's population density, giving you an initial Ground Risk Class (iGRC).
This isn't just about ticking a box. The calculator turns abstract risk into hard data, which becomes a cornerstone of your Specific Operations Risk Assessment.
Getting to Grips With the SORA Geography Calculator

At its heart, the SORA geography calculator is an automated system designed to figure out the risk to people within your planned flight zone. It's a key part of the EASA regulatory framework, pushing pilots away from subjective estimates and towards a standardized, data-driven approach to safety.
The main output you'll get from this analysis is the initial Ground Risk Class (iGRC). You can think of this as a straightforward risk score for your location, based entirely on how many people are likely to be around.
- A low iGRC (like a 1 or 2) usually means you're looking at a rural or sparsely populated area. Think open fields, or maybe an industrial park on a Sunday.
- A high iGRC (say, a 6 or 7) points to a densely populated spot. We're talking city centres, residential neighbourhoods, or bustling commercial areas during business hours.
The Jump From SORA 2.0 to 2.5
The methodology behind this has evolved, with the move from SORA 2.0 to 2.5 marking a significant step up. This update really improved how the tool evaluates risk. SORA 2.5 uses a much more detailed grid system, breaking down your operational area into lots of tiny cells, or "quanta," and assigning an iGRC to each one.
This fine-grained approach is a game-changer. By crunching the numbers on many smaller cells, the system gives you a much more accurate picture of the ground risk. It's especially useful in complex urban environments where population density can shift dramatically from one street to the next. You can dig into the technical details in the latest SORA guidelines.
To give you a clearer idea, here's a quick breakdown of what the different iGRC levels generally represent.
Ground Risk Class (iGRC) Explained
This table provides a quick reference for the typical iGRC levels you'll encounter and what they mean in the real world.
| iGRC Level | Risk Description | Typical Environment |
|---|---|---|
| 1-2 | Very Low | Remote areas, open countryside, unpopulated coastlines. |
| 3-4 | Low | Sparsely populated rural areas, industrial estates (out of hours). |
| 5-6 | Medium | Suburban residential areas, parks, smaller town centres. |
| 7-8 | High | Densely populated urban areas, city centres, busy commercial districts. |
| 9-10 | Very High | Major event venues, transport hubs, exceptionally dense city centres. |
Understanding these classifications helps you immediately contextualise the calculator's output for your flight plan.
Key Takeaway: The SORA geography calculator is more than just a compliance hoop to jump through; it's a fundamental strategic tool. The iGRC it spits out will directly shape the mitigations and operational procedures you need to put in place for a safe, legal flight.
When you grasp this, the calculator stops being a chore and becomes a valuable part of your planning workflow. By interpreting its results correctly, you can make smarter decisions that protect your drone, your reputation, and most importantly, the public.
How to Prepare Your Dronedesk Flight Plan

The success of your SORA geography calculator analysis comes down to one thing: the quality of your flight plan. It's a classic case of garbage in, garbage out. Spending just a few extra minutes to properly define your mission in Dronedesk will make all the difference in building a solid, compliant safety case. It all begins with being crystal clear about where you're going to fly.
Your flight plan is more than just a route; it's the container for your entire operation. We call this the operational volume, and precision is key. If you draw a huge, sloppy area around your target, you're almost guaranteed to pull in high-risk zones that have nothing to do with your flight. This will immediately inflate your initial Ground Risk Class (iGRC) and create a mountain of unnecessary mitigation work.
Think about it this way: you're doing a simple roof inspection on one building in a massive commercial park. If you draw your operational area around the whole park, the calculator sees everything inside—the busy car parks, public footpaths, and the coffee shop with its outdoor seating. Suddenly, your iGRC is through the roof for no good reason.
Defining Your Operational Volume
The smart move is to plot a tight, clean boundary that covers only the building you're inspecting and the immediate airspace you need. This laser focus tells the SORA geography calculator to analyze only what’s relevant, giving you a far more accurate and realistic risk profile right from the start.
Next up is your flight altitude. This sets the vertical limit of your operational volume. Be practical and specific here. If you're inspecting a 30-meter-tall building, setting your max altitude to 40 meters gives you a sensible buffer without needlessly expanding your airspace.
A tightly defined operational volume is the single most important factor for an accurate iGRC. Sloppy boundaries create a flawed foundation for your entire risk assessment, forcing you to mitigate risks that don't actually apply to your mission.
With your boundaries locked in, go ahead and plot your intended flight path. This visual check is a great way to confirm that your volume is big enough for the job but still as compact as it can be. More often than not, this is where you'll spot opportunities to tighten things up even more.
Incorporating Buffer Zones and Intel
Once your flight volume is set, you need to plan for the unexpected by adding buffer zones. These are crucial safety margins around your operational area that account for where the drone might end up in an emergency. The size of the buffer will depend on your specific drone and the mission's risk profile.
Adding these buffers isn't optional—it's a must. And yes, they expand the total area that the SORA calculator analyzes. This is exactly why your initial operational volume needs to be so precise. A small, accurate flight area with the required buffer is always better than a huge, vague one. To see how this fits into the bigger regulatory picture, it’s worth exploring what dedicated SORA compliance software can do for you. https://blog.dronedesk.io/sora-compliance-software/
Finally, your prep work isn't done without some local, on-the-ground intelligence. The calculator has population data, but it can't see everything.
- Spot Sensitive Locations: Are there any schools, hospitals, or care homes nearby? Mark them on your plan. Their presence demands extra caution and planning.
- Check for Temporary Events: Is a local market, festival, or football match scheduled for flight day? These events create sudden population spikes the calculator won't know about.
- Consider the Time of Day: That commercial park is a completely different place at 10 AM on a Tuesday compared to 7 PM on a Sunday. Timing your flight is one of the most powerful mitigation tools you have.
By building your flight plan with this level of detail, you’re feeding the SORA geography calculator the high-quality data it needs to produce a risk assessment you can actually stand behind.
Firing Up the SORA Calculator for Your Mission
Okay, so you've got your flight plan meticulously dialled in. Now it’s time to shift from preparation to analysis. Running the SORA geography calculator in Dronedesk is dead simple, but the real art is in reading the tea leaves—interpreting what it spits out. This isn't just about getting a number; it's about deeply understanding what that number means for your mission's safety and compliance.
Kicking off the analysis is the easy bit. The tool grabs your defined operational volume, including those all-important buffer zones, and crunches it against a mountain of geographical and population data. What you get back is a colour-coded risk map, giving you an instant, visual feel for the ground risk across your entire flight area.
This graphic breaks down the simple three-stage process for getting your geographic risk assessment.
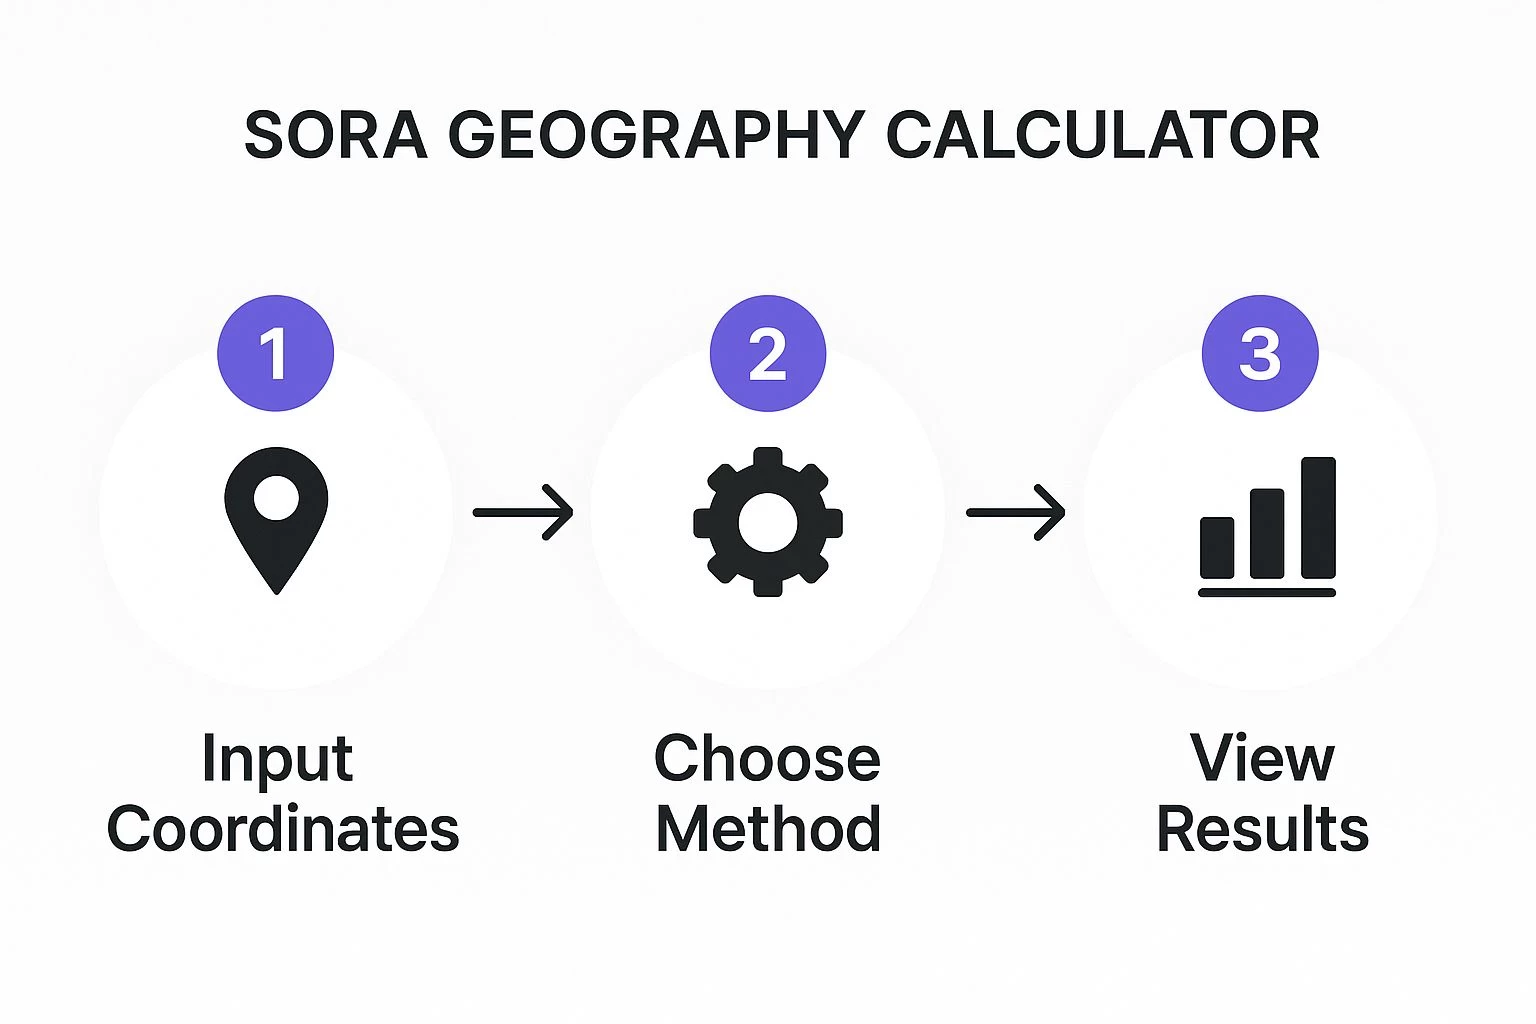
The whole flow, from plugging in your flight plan to seeing the results, is designed to be seamless. It turns complex, heavy data analysis into intelligence you can actually use.
Making Sense of the Risk Map
Your first job is to zero in on the highest initial Ground Risk Class (iGRC) value anywhere within that analyzed area. This one number sets the entire tone for your risk assessment. It doesn't matter if 95% of your flight path is over a deserted field (iGRC 2); if you so much as clip the corner of a busy park (iGRC 6), you have to plan all your mitigations as if it were an iGRC 6 operation.
This screenshot shows a typical SORA geography calculator output inside Dronedesk. You can see how the colour-coded overlay immediately flags areas of varying risk, letting you pinpoint potential hotspots in your operational volume.
Let's walk through a real-world scenario. Say you're doing a survey of a commercial property. The analysis flags a tiny, red-coloured zone with an iGRC of 7 right on the edge of your flight path. A quick look at a map reveals it’s a public footpath that's popular with locals. Right there, the tool goes from being a simple calculator to a powerful decision-making partner.
The highest iGRC isn't the end of the story; it's the beginning. It's a big red flag that tells you exactly where to focus your attention and what specific risks you need to hammer down with operational tweaks or technical solutions.
This data-first mindset is the absolute core of the SORA methodology. Its whole development was pushed by the need for a standardized, data-backed way to manage risk for drone operations. The ground risk models use population density data from official sources like census statistics to assign iGRC values. This has been a game-changer, allowing aviation authorities to create consistent drone safety rules based on tangible, measurable geographical risks.
Tweaking Your Plan Based on the Results
Seeing a high iGRC doesn't mean you have to pack up and go home. Not at all. It just means it's time to put your thinking cap on and make some smart adjustments.
Going back to our footpath example, you now have a few clear, actionable options to knock that risk on the head:
- Adjust the Flight Path: Can you nudge your drone's route just enough to create more distance from the footpath? A small change might be all it takes to remove that high-risk zone from your operational volume entirely.
- Change the Time of Day: What if you flew at the crack of dawn, long before the path is busy with joggers and dog walkers? Shifting your flight time is a surprisingly powerful mitigation tactic.
- Implement Ground Control: If it's a quick job, could you use a couple of spotters and some temporary signage to pause pedestrian traffic for the few minutes the drone is directly overhead?
These are the kinds of practical, real-world adjustments that show you're thinking like a pro. By using the SORA calculator's output to proactively tackle the risks it finds, you're building a much more robust safety case. This process turns your drone flight plan from a static map into a living, breathing, risk-aware strategy for your operation.
Turning Your Risk Assessment into Action

Running your numbers through a risk calculator is one thing. Knowing what to do with the results is what separates the pros from the amateurs. The data you get from the SORA geography calculator isn’t just a number to file away; it’s your roadmap for building a safer, more compliant mission from the ground up.
This is where your pilot-in-command decision-making really kicks in. The calculator’s initial Ground Risk Class (iGRC) gives you a clear, data-driven starting point for all your mitigation strategies. An operation with a low iGRC of 2 demands a completely different set of safety measures than one clocking in at a high 7, and your safety case needs to show you understand why.
From iGRC to Mitigation Strategy
A high iGRC shouldn't stop your mission in its tracks. Instead, think of it as a guidepost, pointing you directly to the specific risks you need to manage. Your job is to translate that risk level into concrete, real-world actions that reduce the potential for harm to people on the ground.
For example, an iGRC of 5 over a suburban park points to a moderate number of people. Your immediate thought should be about minimizing exposure during peak hours. On the other hand, an iGRC of 2 in a remote field means you can likely focus your attention on other factors, like air risk, with minimal extra ground risk mitigation.
This is the very heart of the SORA process. EASA's adoption of SORA 2.5 was driven by the need for this kind of precise ground risk mapping, especially in dense urban areas where populations can be incredibly high. Considering drone failure rates for medium-risk flights are estimated around 1% per flight hour, you can see why the calculator's detailed population data is so vital.
Building Your Action Plan
Your response to the calculator’s findings can take many forms, but the goal is always the same: demonstrate that you’ve identified a risk and taken proportional steps to control it.
Here are a few practical, actionable mitigations you can build directly from your iGRC analysis:
- Fly at a different time: If an area has a high iGRC because of lunchtime crowds or weekday business activity, could you fly at dawn? Or on a Sunday? A simple timing shift can plummet the number of people at risk.
- Adjust your flight path: Sometimes, a small tweak is all it takes. Nudging your flight plan just slightly away from a known public footpath or a popular outdoor cafe can make a huge difference to your peak iGRC.
- Bring in better tech: For those unavoidable high-risk zones, you might need to justify using advanced safety equipment. The data from the SORA geography calculator is the perfect evidence to support deploying a parachute system or other containment measures.
- Get boots on the ground: In some scenarios, the best solution is active management. Using spotters to manage pedestrian traffic or setting up a temporary cordon ensures the area under the drone stays clear during critical flight phases.
The table below gives a clearer picture of how you might approach mitigations for different iGRC levels.
Risk Mitigation Strategies Based on iGRC
This table outlines some common mitigation actions drone operators can take in response to different iGRC levels identified by the calculator.
| iGRC Level | Potential Risk | Example Mitigation Strategy |
|---|---|---|
| Low (1-3) | Very low population density, minimal exposure | Standard operating procedures are likely sufficient. Focus on air risk and general situational awareness. |
| Medium (4-6) | Moderate population density, intermittent people | Fly during off-peak hours. Adjust flight path to avoid known gathering spots (e.g., park benches, bus stops). |
| High (7+) | High population density, constant presence of people | Implement enhanced containment (e.g., parachute), use ground crew and cordons, or seek an alternative location. |
Ultimately, these strategies are about showing a clear, logical link between the data-driven risk and your planned safety actions.
Remember, every single mitigation you apply has to be documented. This creates a clear audit trail showing exactly how you used the calculator's data to inform your safety decisions—which is precisely what aviation authorities want to see.
Documenting these choices properly within Dronedesk is critical. When you link your mitigation strategies directly to the iGRC values, you create a robust safety case that is both compliant and easily defensible. For a deeper look at structuring this documentation, have a look at our guide on drone risk assessment checklists.
Avoiding Common Pitfalls & Pro Tips
Even with a tool as robust as the SORA geography calculator, it’s surprisingly easy to make simple mistakes that can throw off your entire risk assessment. I see it all the time. One of the biggest offenders is defining an overly large operational area. It's a classic case of casting the net too wide.
When you do this, you instantly inflate your risk by pulling in unrelated high-density zones. Suddenly, you're forced to mitigate for hazards that have absolutely nothing to do with your actual mission.
Another classic error is forgetting about temporary population spikes. The calculator is smart, but it's working with static, census-based data. It has no idea there’s a local festival or a bustling farmers market right next to your flight zone on a Saturday morning. That's where your own due diligence and local knowledge have to fill in the gaps.
Advanced Tips for Complex Operations
For more involved missions, like long-distance BVLOS (Beyond Visual Line of Sight) corridor flights, trying to run a single, monolithic analysis is just inefficient. It doesn't give you a true picture of the risks. The pro-level move here is to segment your route into distinct legs.
Let's say you're running a pipeline inspection that starts in a rural area (iGRC 2) and crosses into a suburban one (iGRC 5). Instead of analyzing the whole route as one, you break it down:
- Segment 1 (Rural): Analyze this section on its own. The lower risk here will likely mean more straightforward operational procedures and fewer complex mitigations.
- Segment 2 (Suburban): This is your higher-risk segment. It needs its own analysis, which will probably lead to a more robust set of mitigations—things like flying at off-peak hours or bringing in enhanced surveillance.
This segmented approach gives you a much more accurate and manageable risk picture. It allows you to apply proportional mitigations precisely where they're needed, which is a clear sign of operational maturity.
Expert Insight: Here's a shift in mindset I always recommend: Don't just see the SORA geography calculator as a box-ticking exercise. Treat its output as a direct feed into your safety culture. Use the data to ask proactive questions like, "How can we actively reduce our ground risk footprint here?" instead of just, "Okay, how do we mitigate this high iGRC?"
Making that small mental shift moves you from simply being compliant to truly mastering a core competency in drone safety. By sidestepping these common errors and applying more advanced techniques, you can build risk assessments that are not only compliant but also robust, defensible, and genuinely effective out in the field. It’s about making sure your safety case stands up to scrutiny, every single time.
Got Questions? We've Got Answers
Even with the best guides, you're bound to have some specific questions pop up when you start using a new tool like the SORA geography calculator. Let's tackle some of the most common ones we hear from pilots.
What About Temporary Events like Festivals or Football Matches?
This is a big one. Pilots often ask if the calculator knows about things that temporarily ramp up population density, like a weekend street market or a big sporting event.
In short, no. The calculator's data comes from stable, long-term sources like a national census. It has no way of tapping into real-time events or short-term gatherings that draw a crowd.
This is where your pilot-in-command responsibilities kick in. It's on you to do the on-the-ground reconnaissance during your pre-flight planning. If you spot a temporary event, you need to manually adjust your risk assessment to account for that increased ground risk.
Key Takeaway: Think of the SORA geography calculator as your baseline. It's a fantastic starting point, but you always have to layer your own current, real-world intelligence on top to get the full picture for the specific day and time of your flight.
How Do I Handle an Area with Multiple Risk Levels?
So, what do you do when your flight plan slices through different iGRC levels? Maybe you're starting in a quiet industrial park (iGRC 3) but your route clips the edge of a bustling residential neighbourhood (iGRC 6).
The rule here is straightforward and non-negotiable for both safety and compliance: you must always plan for the highest iGRC level within your entire operational volume. That includes not just your flight path, but also any contingency areas and buffer zones you’ve marked out.
This means your entire safety case, including all your mitigation strategies, has to be tough enough to handle the risks of that highest classification. You can't just average out the risk or apply certain precautions to only one part of the mission.
Can I Use This Calculator Outside of EASA Regions?
Finally, we get asked if the SORA geography calculator is good to go for flights outside the European Union Aviation Safety Agency (EASA)'s patch.
While the SORA methodology itself is definitely gaining traction around the world, the specific tools and compliance hoops we're talking about here are hard-wired to EASA regulations. If you're flying in another country, you play by the rules of their local civil aviation authority.
Those authorities might have entirely different risk assessment frameworks, their own bespoke tools, or unique methodologies. The bottom line is to always check and stick to the local regulations wherever you're flying.
Ready to pull your entire drone operation—from flight planning to risk assessment—into one place? Dronedesk builds powerful tools like the SORA geography calculator right into a seamless workflow. Start your free trial today and see how much time you can save.
 Drone Legal Requirements for Commercial Operations →
 Drone Near Airport Rules Explained for Safer Planning →
 International Drone Regulations Every Global Team Should Know →
 Drone Flight Risk Assessment Example for Safer Missions →
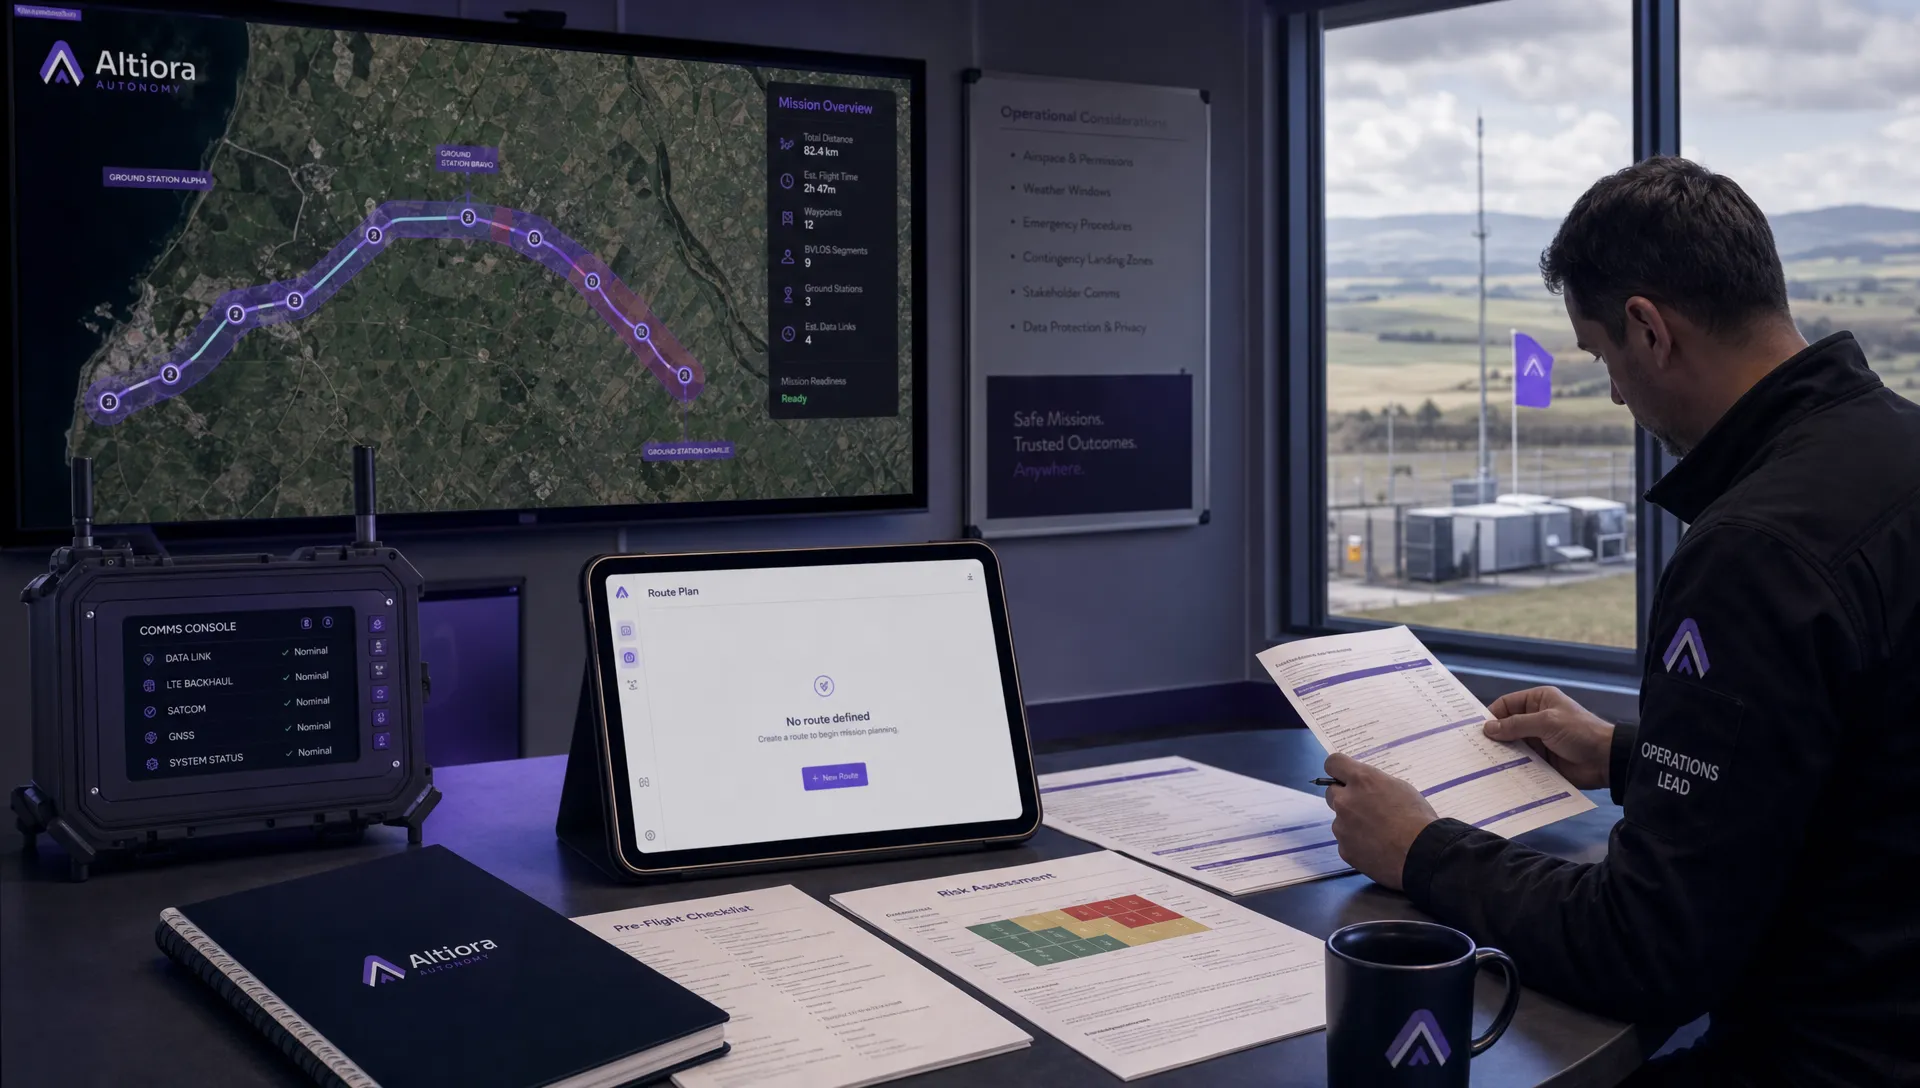 Beyond Visual Line of Sight Explained for Operators →
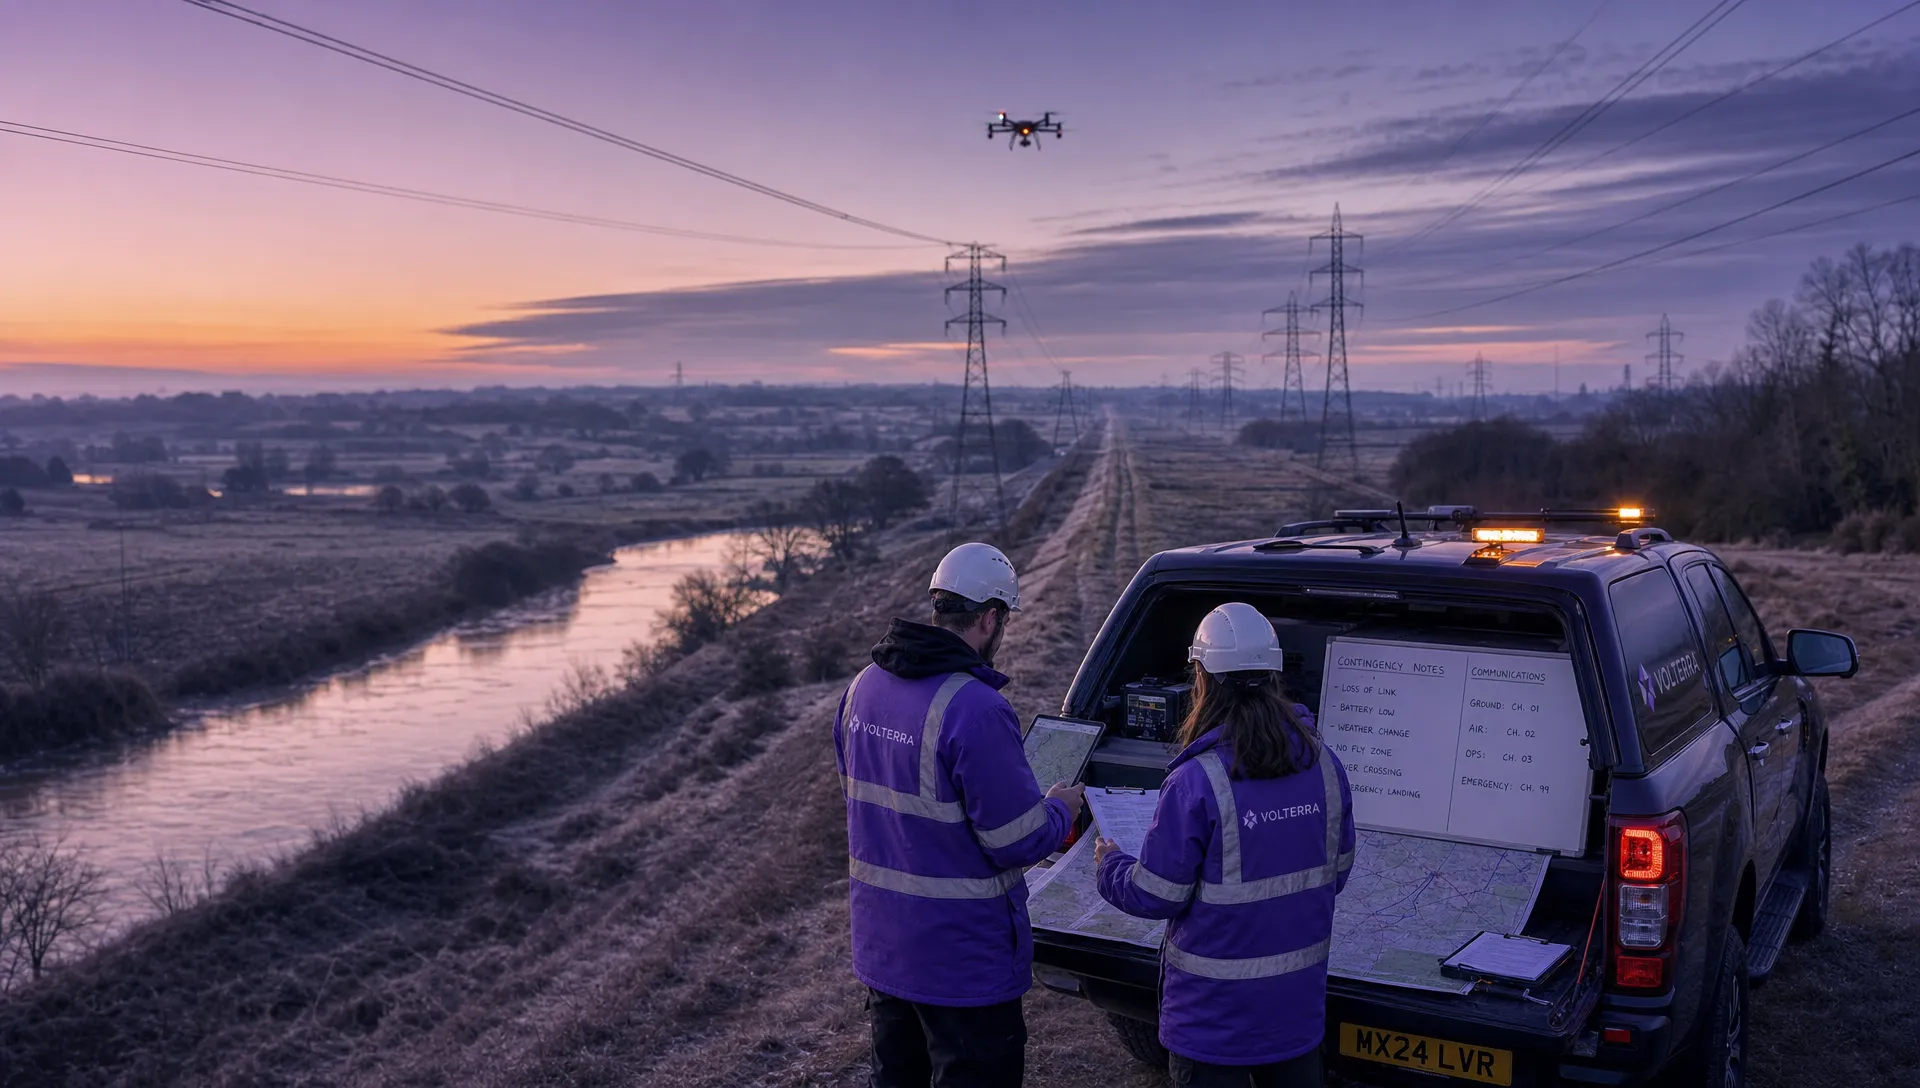 How BVLOS Drone Operations Change Commercial Workflows →
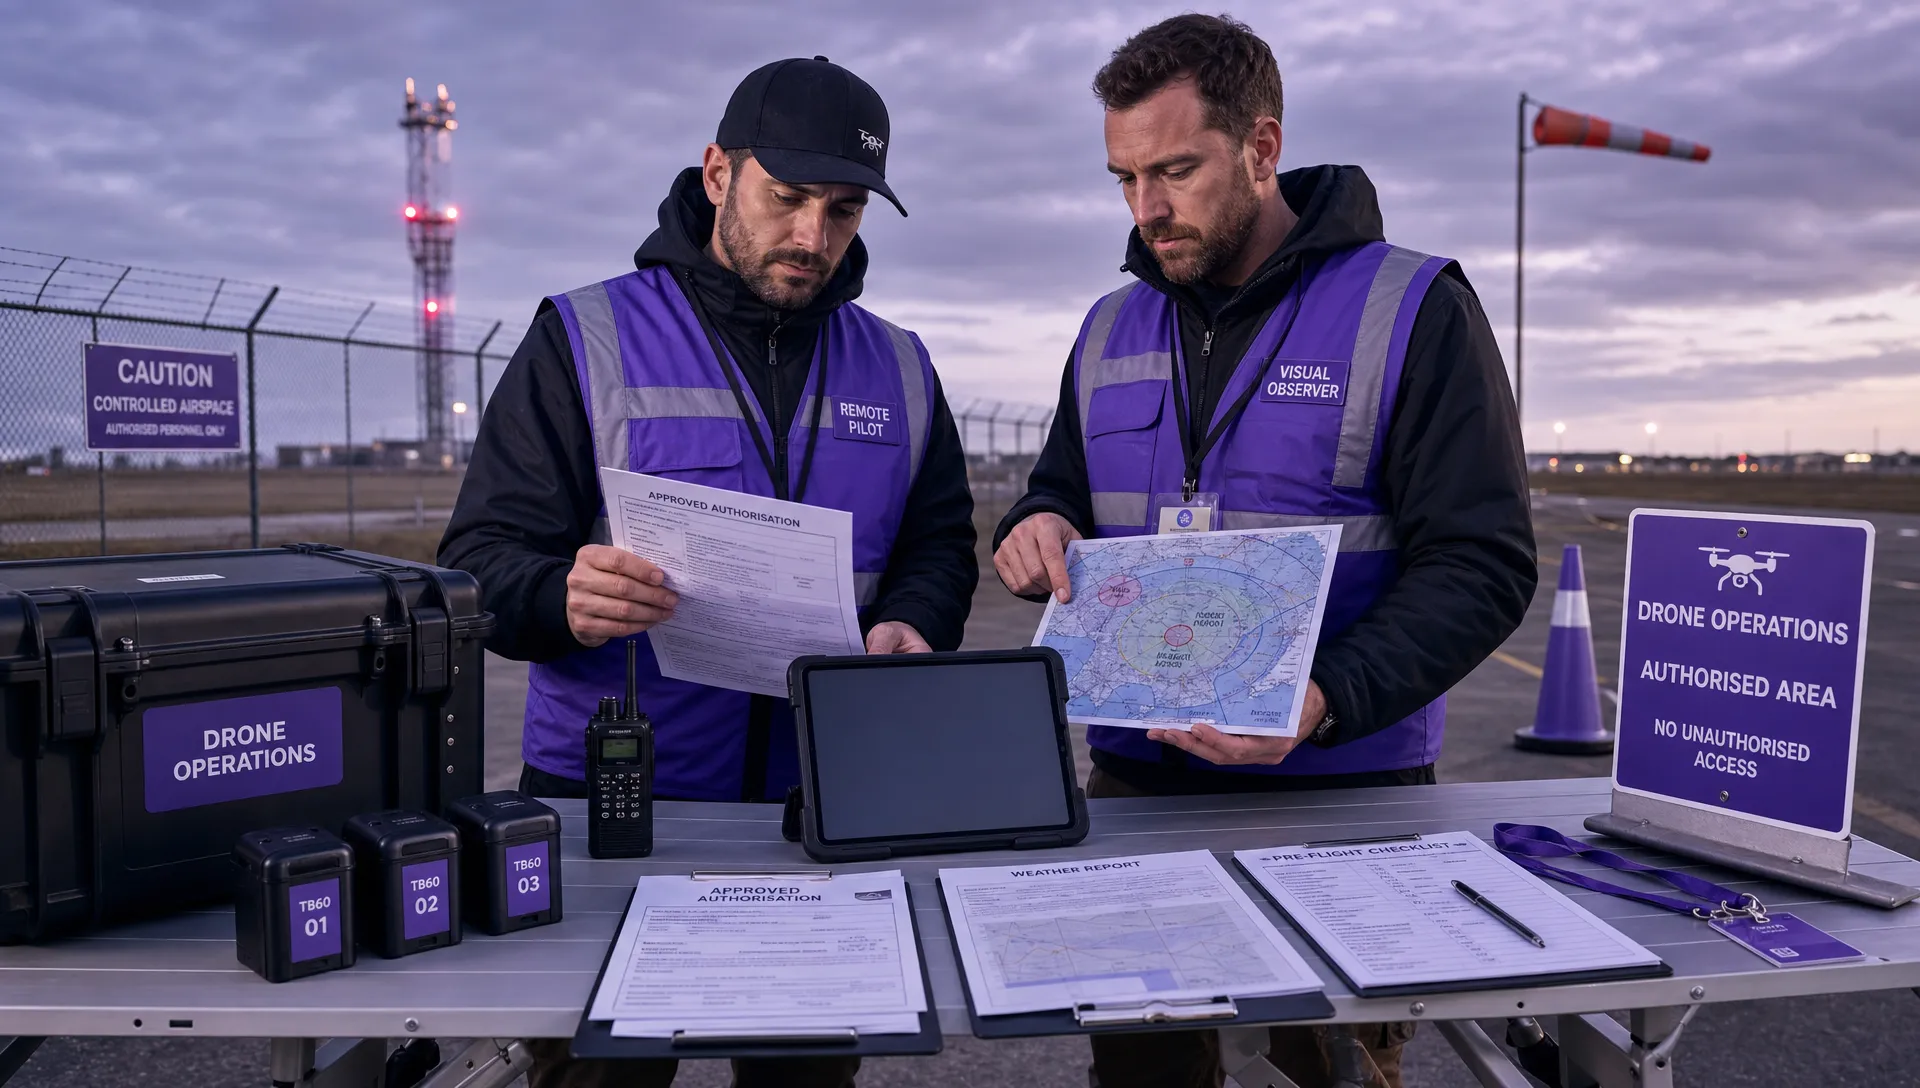 FAA Drone Rules Every Commercial Pilot Should Know →
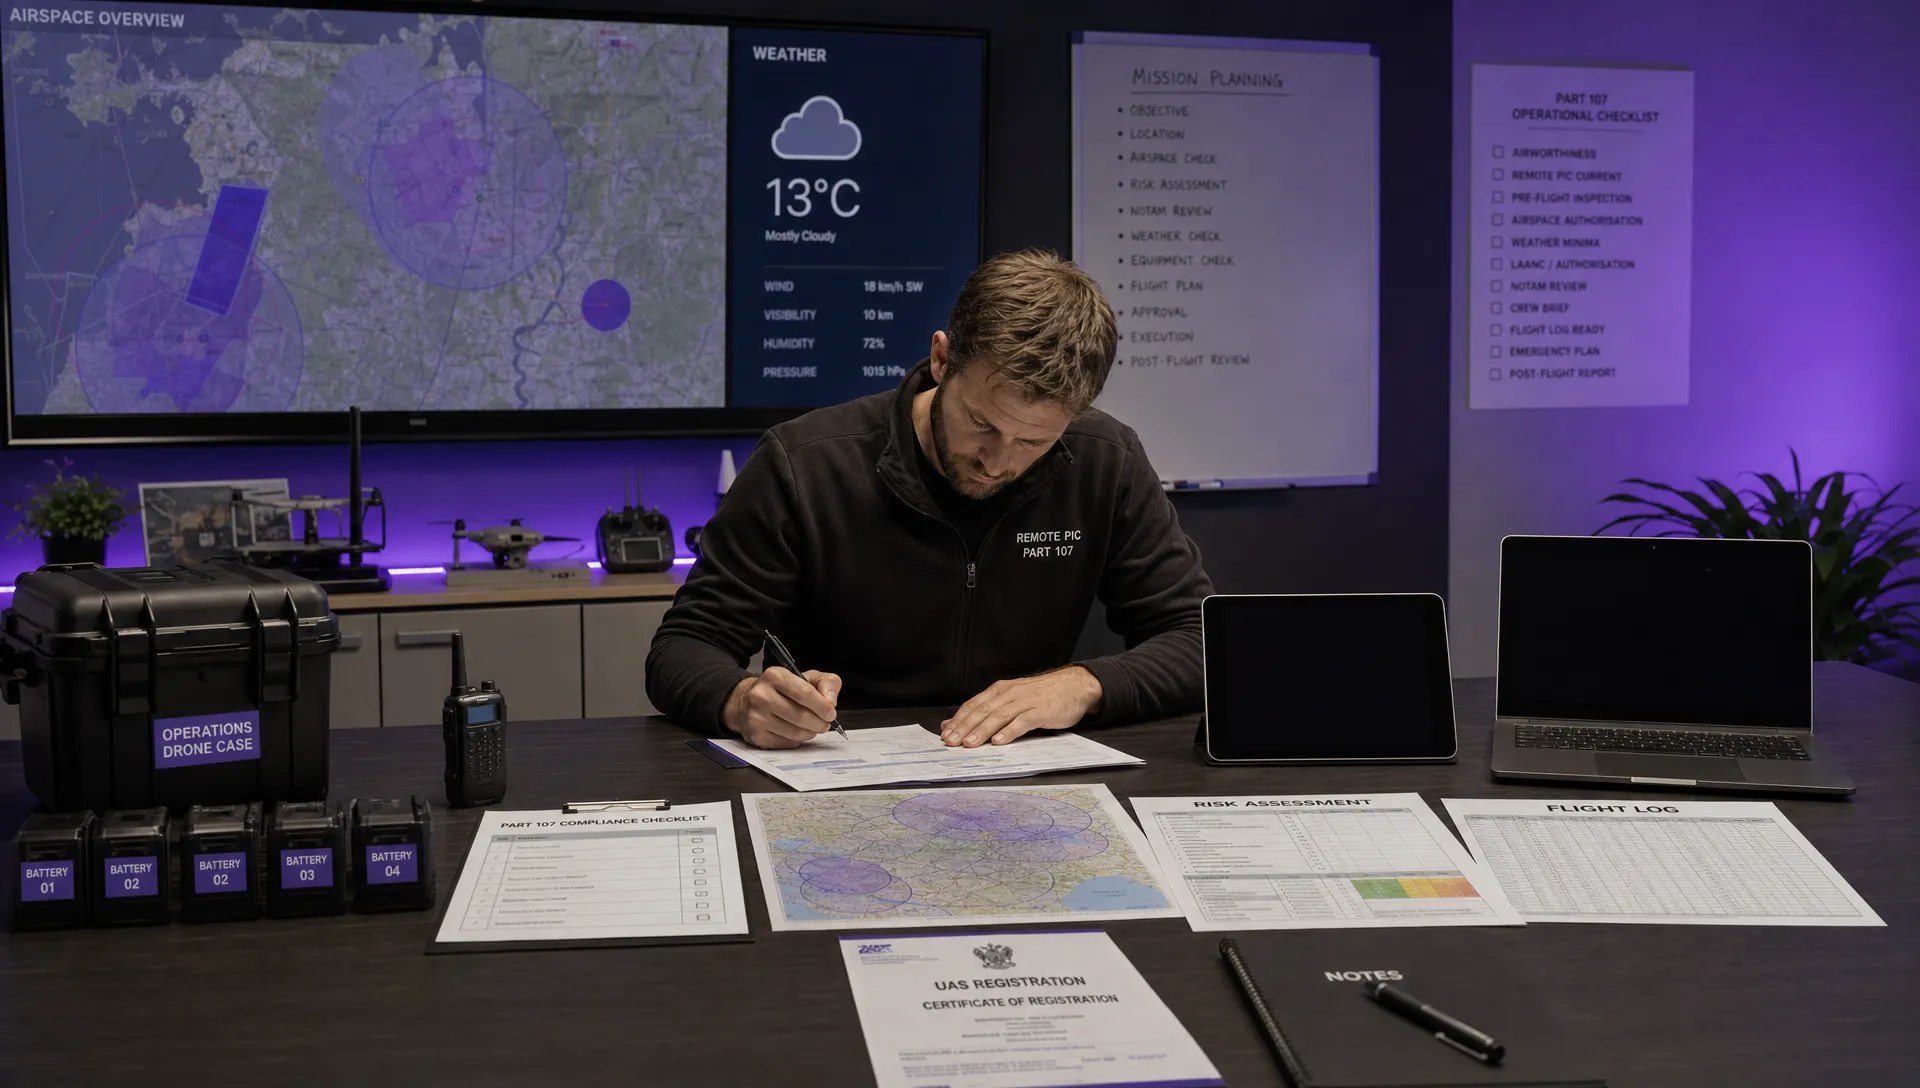 FAA 107 Explained for Commercial Drone Operators →
 Canadian Drone Regulations Explained for Business Use →
 FAA Part 107 Drone License Explained for Beginners →