F1 Telemetry Data Explained: From Sensor to Strategy
You're probably already doing some version of telemetry work, even if you don't call it that. A drone pilot watches battery state, GPS position, control inputs, wind effect, and mission progress. An F1 race engineer does the same kind of job under harsher time pressure and with much tighter performance margins.
That's why Formula 1 is useful to study. Not because most operators need race-car data rates, but because F1 makes the operating model obvious. Sensors feed a live system. Engineers decide what matters now, what can wait, and what action to take before the next decision window closes. That pattern transfers directly to professional drone operations.
The Digital Nervous System of a Formula 1 Car
On the pit wall, telemetry isn't a nice-to-have dashboard. It's the live signal path between the car and the engineers responsible for keeping it fast, reliable, and on plan. If a brake temperature trend starts moving the wrong way, or a driver's throttle trace changes in one corner, the team wants to see it immediately, not after the session.
That's why I describe F1 telemetry data as the car's digital nervous system. Sensors act like nerves. The electronics and data pipeline carry those signals. Engineers interpret the pattern and respond. Without that loop, the car is still fast, but the team is partly blind.
Cadence notes that by 2022 each F1 car carried around 300 sensors and generated approximately 1.1 million telemetry data points per second transmitted from car to pit, creating a real-time digital twin of performance and health, as described in Cadence's overview of Formula 1 telemetry.
What that scale actually means
Those numbers matter less as trivia and more as an engineering clue. Teams aren't looking at one speed trace and one lap time. They're watching a layered stream that reflects:
- Driver intent through throttle, brake, steering, and gear selection
- Vehicle response through speed, acceleration, suspension behavior, and energy deployment
- Component condition through temperatures, pressures, and status channels
- Session context through position on track, lap delta, and changing conditions
A useful comparison for drone teams is this: telemetry isn't just your aircraft log. It's the operational picture that tells you whether the aircraft is doing what the pilot commanded, whether the platform is behaving normally, and whether the mission remains safe to continue.
F1 teams don't win because they collect data. They win because they can turn data into a decision while the decision still matters.
That's the core lesson. The sensor count is impressive, but the closed loop is the primary asset.
Understanding the Purpose of F1 Telemetry
Telemetry exists to support action. If the data doesn't change setup, strategy, driver coaching, or fault response, it's just storage.
In Formula 1, the stream functions a lot like a patient monitor in intensive care. You don't stare at a single number. You watch trends, correlations, and sudden changes. A stable reading is useful. A change under load is often more useful. In the same way, F1 telemetry data matters because it shows what the car is doing in context, corner by corner and lap by lap.
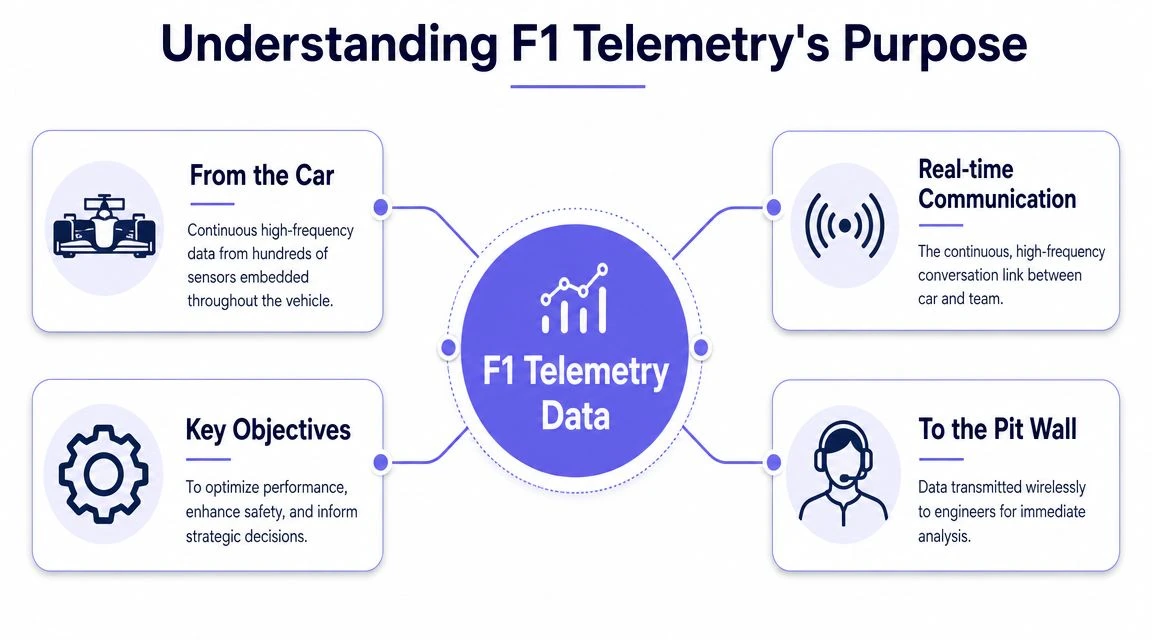
Catapult explains that telemetry provides live measurements such as speed, tire pressure, engine performance, fuel consumption, engine temperatures, and brake conditions, supporting immediate calls on pit stops, tire changes, and technical adjustments in its look at how F1 data analysis shapes performance.
The three jobs telemetry must do
The easiest way to understand the purpose is to break it into operational jobs.
- Performance control means finding out where time is gained or lost. That may involve braking points, throttle pickup, corner minimum speed, or how the car behaves over kerbs.
- Reliability protection means spotting signs of stress early enough to avoid a retirement or degraded performance. Temperature trends and abnormal behavior matter here.
- Strategy support means feeding race decisions with current information, not assumptions. Tire condition, fuel use, brake state, and pace trends all shape those calls.
Why raw visibility isn't enough
A common mistake is to think more channels automatically create more insight. They don't. Teams need a hierarchy. Some signals demand immediate attention. Others are useful only when compared against a prior lap, another car, or a post-run download.
That distinction matters in drone work too. During a live mission, the operator needs a tight set of signals that answer three questions fast:
- Is the aircraft healthy enough to continue?
- Is it executing the mission as intended?
- Is there anything developing that requires intervention now?
Everything else can wait for deeper analysis.
Practical rule: Good telemetry systems reduce decision time. Bad ones just increase screen time.
How Data Travels from the Track to the Pit Wall
The interesting part of telemetry isn't only what gets measured. It's how the signal survives the trip from a vibrating, heat-soaked machine moving at race speed into a form engineers can trust.

At the car, sensors measure states and events across the chassis, power unit, and driver controls. Those values are collected, packaged, and prepared for transmission. What people often underestimate is that the data path isn't just “sensor to graph.” It's a chain of formatting, transport, timing, validation, and ingestion steps. If any of those are weak, the analysis at the end becomes questionable.
The hidden difficulty is ingestion
The F1 2019 telemetry specification is useful here because it shows the shape of the problem clearly. Telemetry is emitted over UDP in discrete packet types for items such as speed, throttle, session data, and car status. The main challenge, as outlined in the F1 2019 telemetry specification, is building the pipeline that can decode, normalize, and ingest those packets reliably in real time.
UDP is fast and practical for streaming, but it doesn't solve the higher-level engineering work for you. Teams still need to answer questions like:
- Schema handling: Which packet carries which fields, and how are they versioned?
- Timestamp integrity: Are channels aligned well enough to compare steering against yaw-related behavior or brake input against speed change?
- Loss tolerance: What happens if a packet arrives late, out of order, or not at all?
- Normalization: How do you turn raw packet structures into channels the analysis tools can query consistently?
For drone operators, this should sound familiar. The difficult part often isn't collecting flight data. It's moving from device-specific logs into something that operations, maintenance, and compliance teams can use without manual cleanup. A good parallel is the work involved in flight data acquisition workflows for drones, where getting the data out cleanly is often harder than plotting it afterward.
What works and what doesn't
What works is a narrow, dependable pipeline with strict channel definitions and timing discipline. What doesn't work is an ad hoc flow where every new sensor or firmware change breaks the downstream dashboards.
In practical terms, reliable telemetry systems usually share a few traits:
- Structured packet definitions so everyone agrees on what each field means
- Synchronized logging so channel comparisons remain valid
- Clear ingestion rules for missing or malformed data
- Separation between live and post-run analysis so urgent decisions aren't blocked by deep processing
If two channels aren't time-aligned, the chart may still look precise. The engineering conclusion won't be.
That's one of the least glamorous parts of telemetry, and one of the most important.
Decoding the Key Telemetry Data Channels
When engineers talk about telemetry, they usually don't mean one giant spreadsheet. They think in groups of channels that answer different questions. One group tells you what the driver asked the car to do. Another tells you how the car responded. A third tells you whether the hardware is staying within acceptable limits.
The power comes from correlation, not from isolated readings. By correlating channels such as throttle position, brake pressure, steering angle, and suspension movement, engineers can perform causality analysis to work out whether a lap-time difference comes from driver behavior or from the car's setup.
Driver inputs
These channels describe command intent.
Throttle trace shows how aggressively the driver applies power and how early they commit on corner exit. Brake pressure reveals not just when braking starts, but how the release phase is managed into the apex. Steering angle shows line choice, correction rate, and whether the driver is fighting instability or rotating the car cleanly.
Viewed alone, each channel can mislead. A sharp throttle pickup may look decisive, but if wheel behavior and acceleration don't support it, the car may in fact be traction-limited.
Vehicle response
Here, the car answers back.
Speed, gear selection, DRS state, and track position define the basic performance picture. Suspension movement, tire behavior, and acceleration traces fill in the rest. Engineers look for cause and effect across these channels. If entry speed rises slightly, did that come from later braking, improved platform control, or a different line?
That's why telemetry review is often about comparison rather than inspection. If you're curious what that kind of work looks like in practice, Formula 1 data analysis careers gives useful context on the analytical side of motorsport roles.
Component health
The third layer is reliability and operating condition.
Temperatures, pressures, brake condition, and status channels help engineers decide whether the current pace is sustainable. A single value may not look alarming, but the trend can force a change in plan. In both F1 and drone operations, the question isn't “is this part working?” It's “is this part behaving normally under current load?”
The same principle applies when teams work with vehicle networks and machine data in other sectors. For drone teams, CAN bus data logging is a useful adjacent concept because it shows how machine-state data becomes operational evidence.
Key F1 telemetry channels and their purpose
| Data Channel Category | Example Channels | What It Reveals |
|---|---|---|
| Driver inputs | Throttle position, brake pressure, steering angle, gear selection | What the driver commanded the car to do |
| Vehicle dynamics | Speed, acceleration, DRS state, suspension movement, track position | How the car responded to those inputs |
| Component health | Tire temperatures, brake condition, engine-related status, pressures | Whether the car can sustain the demanded performance |
| Comparative channels | Lap delta, minimum corner speed, throttle pickup timing, brake release timing | Where time is being won or lost between laps or cars |
The real analytical move
The mistake non-specialists often make is asking, “What's the most important channel?” Usually, there isn't one. The useful question is, “Which channel combination explains this behavior?”
A lap-time loss rarely lives in a single trace. It usually appears in the relationship between traces.
That's why the best telemetry work feels less like watching gauges and more like reconstructing an event.
Visualizing Data for Teams Broadcasters and Simracers
The same telemetry can produce three very different visual products. Teams want diagnosis. Broadcasters want explanation. Simracers want feedback they can act on before the next lap.
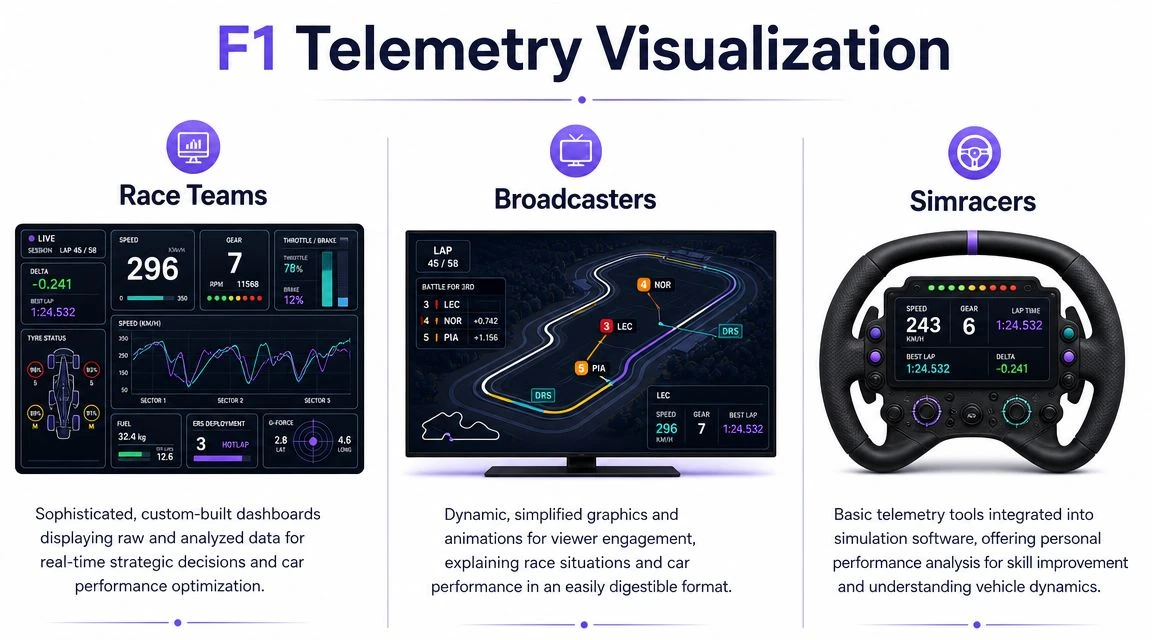
That difference matters because people often confuse “data available” with “data usable.” Good visualization starts by deciding who needs the answer and how quickly they need it.
Race teams want deltas
Trackside engineers care about comparisons. Expert analysis in F1 focuses on deltas, comparing one car or lap against another to identify whether lost time is aerodynamic, mechanical, or driver-related. That only works when the telemetry is precisely synchronized.
For a team, the ideal screen is rarely flashy. It overlays laps, aligns channels to distance or time, flags anomalies, and makes deviations obvious. Engineers might compare brake release timing into a corner, minimum speed at apex, then throttle pickup on exit. If the shapes differ in the wrong place, they can infer where the problem sits.
Typical team views prioritize:
- Overlay traces for speed, throttle, brake, and steering
- Track maps linked to event markers
- Reference laps against current attempts
- Alerting layers for values outside expected operating windows
Broadcasters want a story the audience can absorb
TV graphics simplify aggressively, and that's the right decision. Most viewers don't need raw traces. They need a clean explanation of why one driver is catching another, why a pit stop matters, or how tire condition changes race options.
That's the same logic used in operational reporting elsewhere. You don't give an executive the engineering console. You give them a filtered view with enough signal to support a decision.
Simracers want coaching
The simracing world sits between those two extremes. Enthusiasts often export telemetry into analysis tools, compare their own laps, and use the same delta logic as real teams at a smaller scale. The principles are the same. Brake too early, release too abruptly, pick up throttle too late, and the trace tells on you.
If you want a practical way to experience that difference firsthand, interactive F1 simulator options can be surprisingly useful because they make the link between input, vehicle response, and feedback much more obvious than passive viewing.
The same habit applies in drone work too. A post-flight view is only valuable if it helps the operator answer a concrete question. For teams building that discipline, flight data analysis for drone operations is the closer analogue than a race broadcast graphic.
The best dashboard is the one that removes a bad decision, not the one with the most widgets.
Parallels with Drone Telemetry for Operational Insight
F1 transitions from being motorsport trivia to becoming operationally useful for drone teams.
A Formula 1 car and a professional drone are very different machines, but the telemetry logic is the same. Both platforms generate more information than an operator can process manually in real time. Both operate in environments where timing matters. Both need a structured distinction between live alerts, mission-critical state, and deeper post-run review.
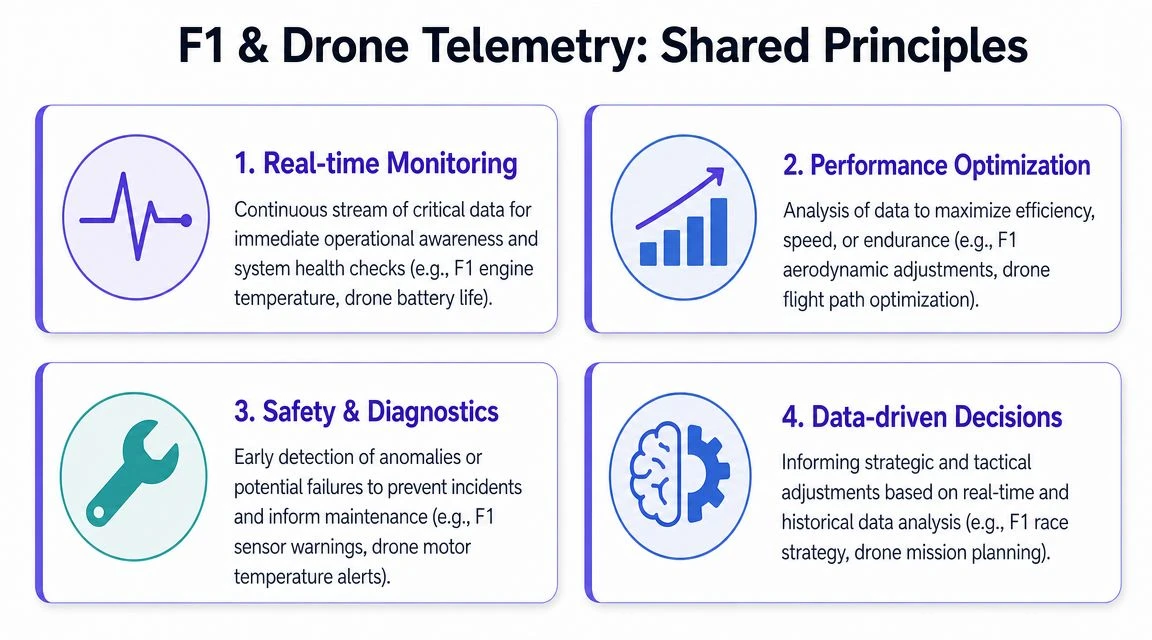
The strongest lessons transfer directly
Microsoft's Azure Data Explorer blog makes the key point well: the competitive edge in F1 doesn't come just from collecting terabytes. It comes from deciding which signals deserve immediate attention and which can wait for post-session analysis, as discussed in Microsoft's look at F1 telemetry analysis.
For drone operations, that means building telemetry around operational questions, not around a desire to save everything forever.
- Real-time monitoring should focus on aircraft health, control status, battery condition, and mission continuation risk.
- Post-mission review should handle trend work such as repeatability, maintenance indicators, route efficiency, and pilot technique.
- Exception handling should highlight abnormalities instead of asking the operator to detect them visually from dense charts.
What this looks like on a drone team
Think about a survey operation, an inspection job, or a recurring mapping route. The F1 approach suggests a clean split.
Live telemetry should answer whether the aircraft is healthy, on plan, and safe to continue. Post-flight analysis should answer whether the route, battery usage, landing profile, and system behavior were normal relative to prior missions.
That's a much better model than trying to use one cluttered dashboard for every purpose.
Where teams usually go wrong
Most telemetry failures in operations are design failures, not sensor failures.
Teams often collect too much low-priority data into the live interface. That increases operator workload and weakens situational awareness. The better approach is selective visibility. Show the signals that can change a decision now. Keep the richer dataset for maintenance, audit, and process improvement.
Drone teams don't need to copy Formula 1's scale. They should copy its discipline.
If you adopt that one idea, telemetry stops being an archive and starts becoming an operational control system.
Access Limitations and the Future of Data in Sport
The raw, high-frequency streams that teams use in F1 aren't public in the form that race engineers see them. That's expected. The detailed live data is part of the competitive edge. Public users usually access a filtered version through broadcast graphics, timing products, official apps, or community tools built around available feeds.
Open-source access has still expanded the ecosystem. As noted earlier, services such as OpenF1 reflect how much broader F1 data access has become outside the pit wall. That doesn't mean outsiders receive the full engineering picture. It means more people can study the structure, timing, and storytelling value of race data.
The important takeaway isn't where to get the raw feed. It's understanding that F1 telemetry data is a complete operating loop. Sensors collect. Systems transport. Engineers prioritize. Analysts compare. The team acts. Then the next cycle begins.
That pattern is spreading well beyond sport. Drone operations are one of the clearest examples because they combine safety, asset health, pilot input, route performance, and compliance into the same workflow. The companies that handle that loop well will make faster decisions, run cleaner fleets, and learn more from every mission.
If you want that kind of closed-loop visibility in your own operation, Dronedesk helps drone teams manage planning, logging, fleet oversight, reporting, and operational analysis in one system. It's built for professional operators who need usable flight data, not just more data.
 Drone Near Airport Rules Explained for Safer Planning →
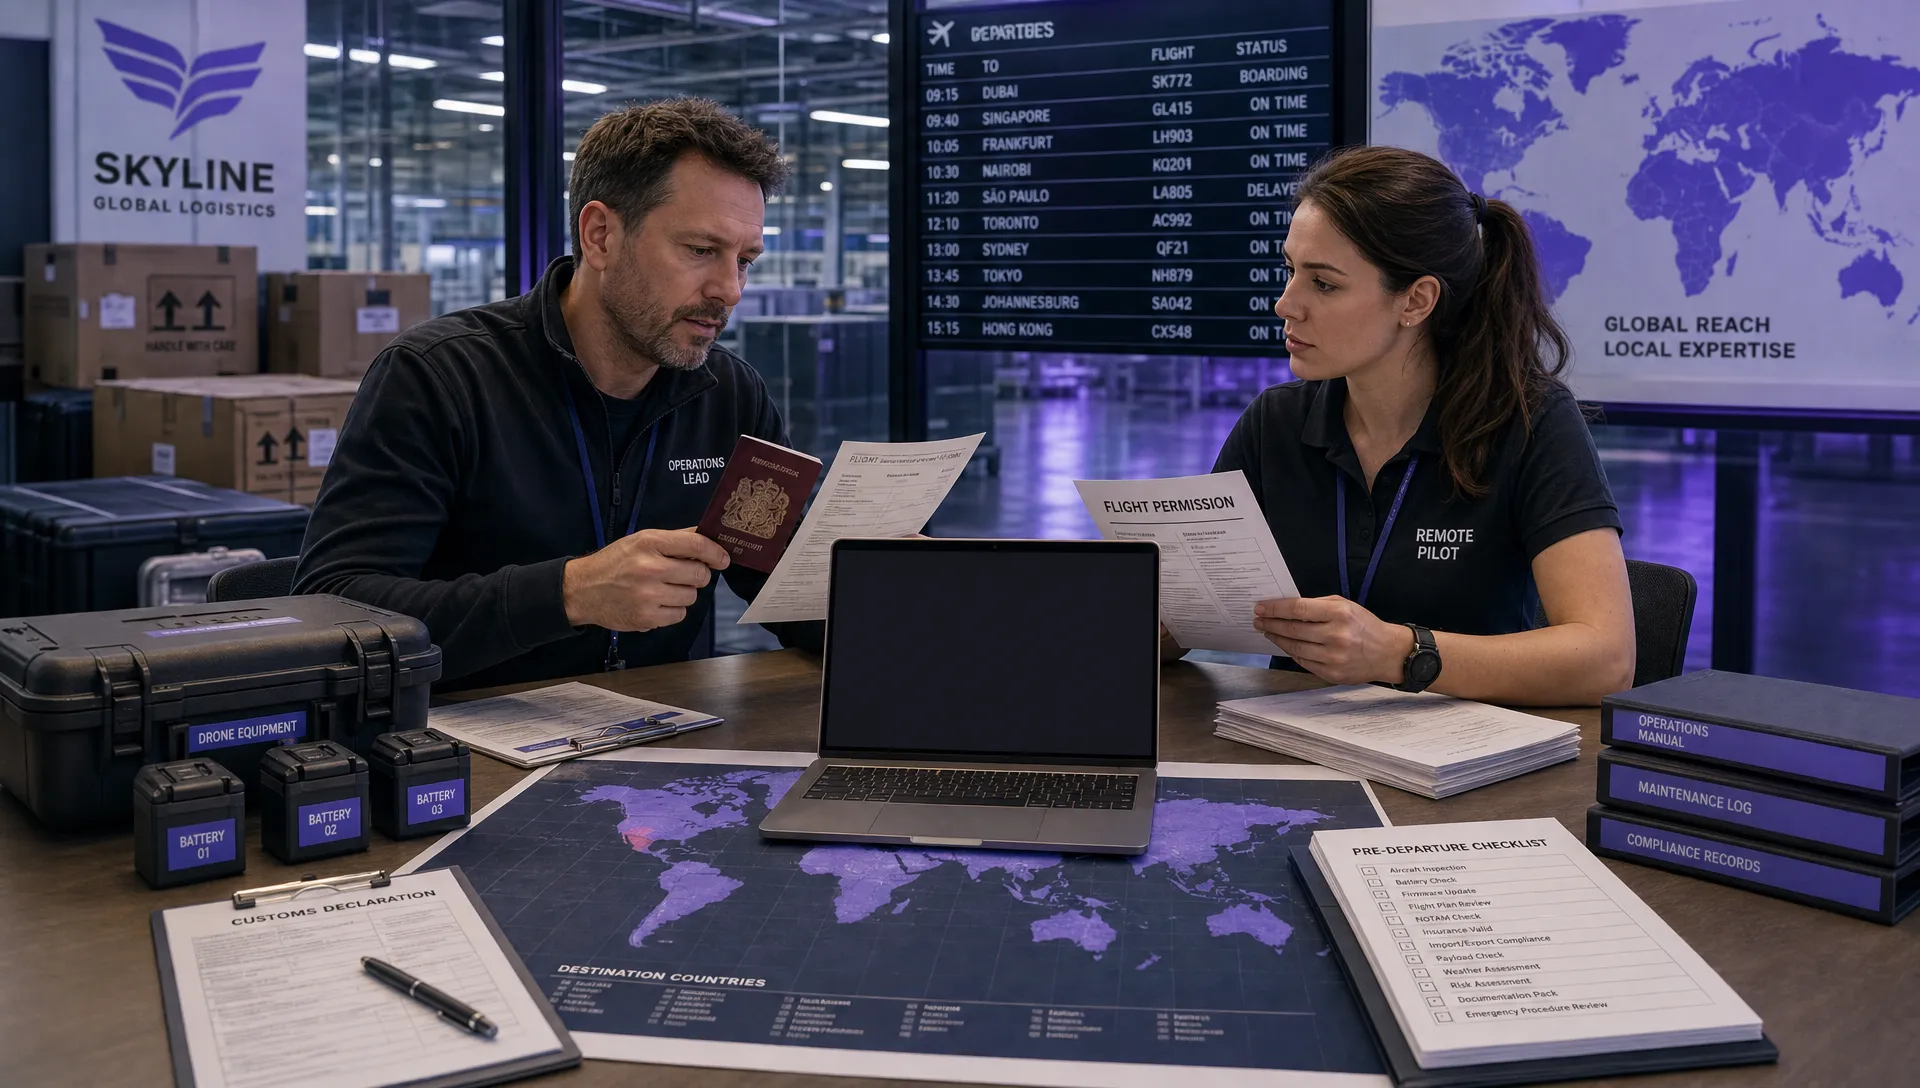 International Drone Regulations Every Global Team Should Know →
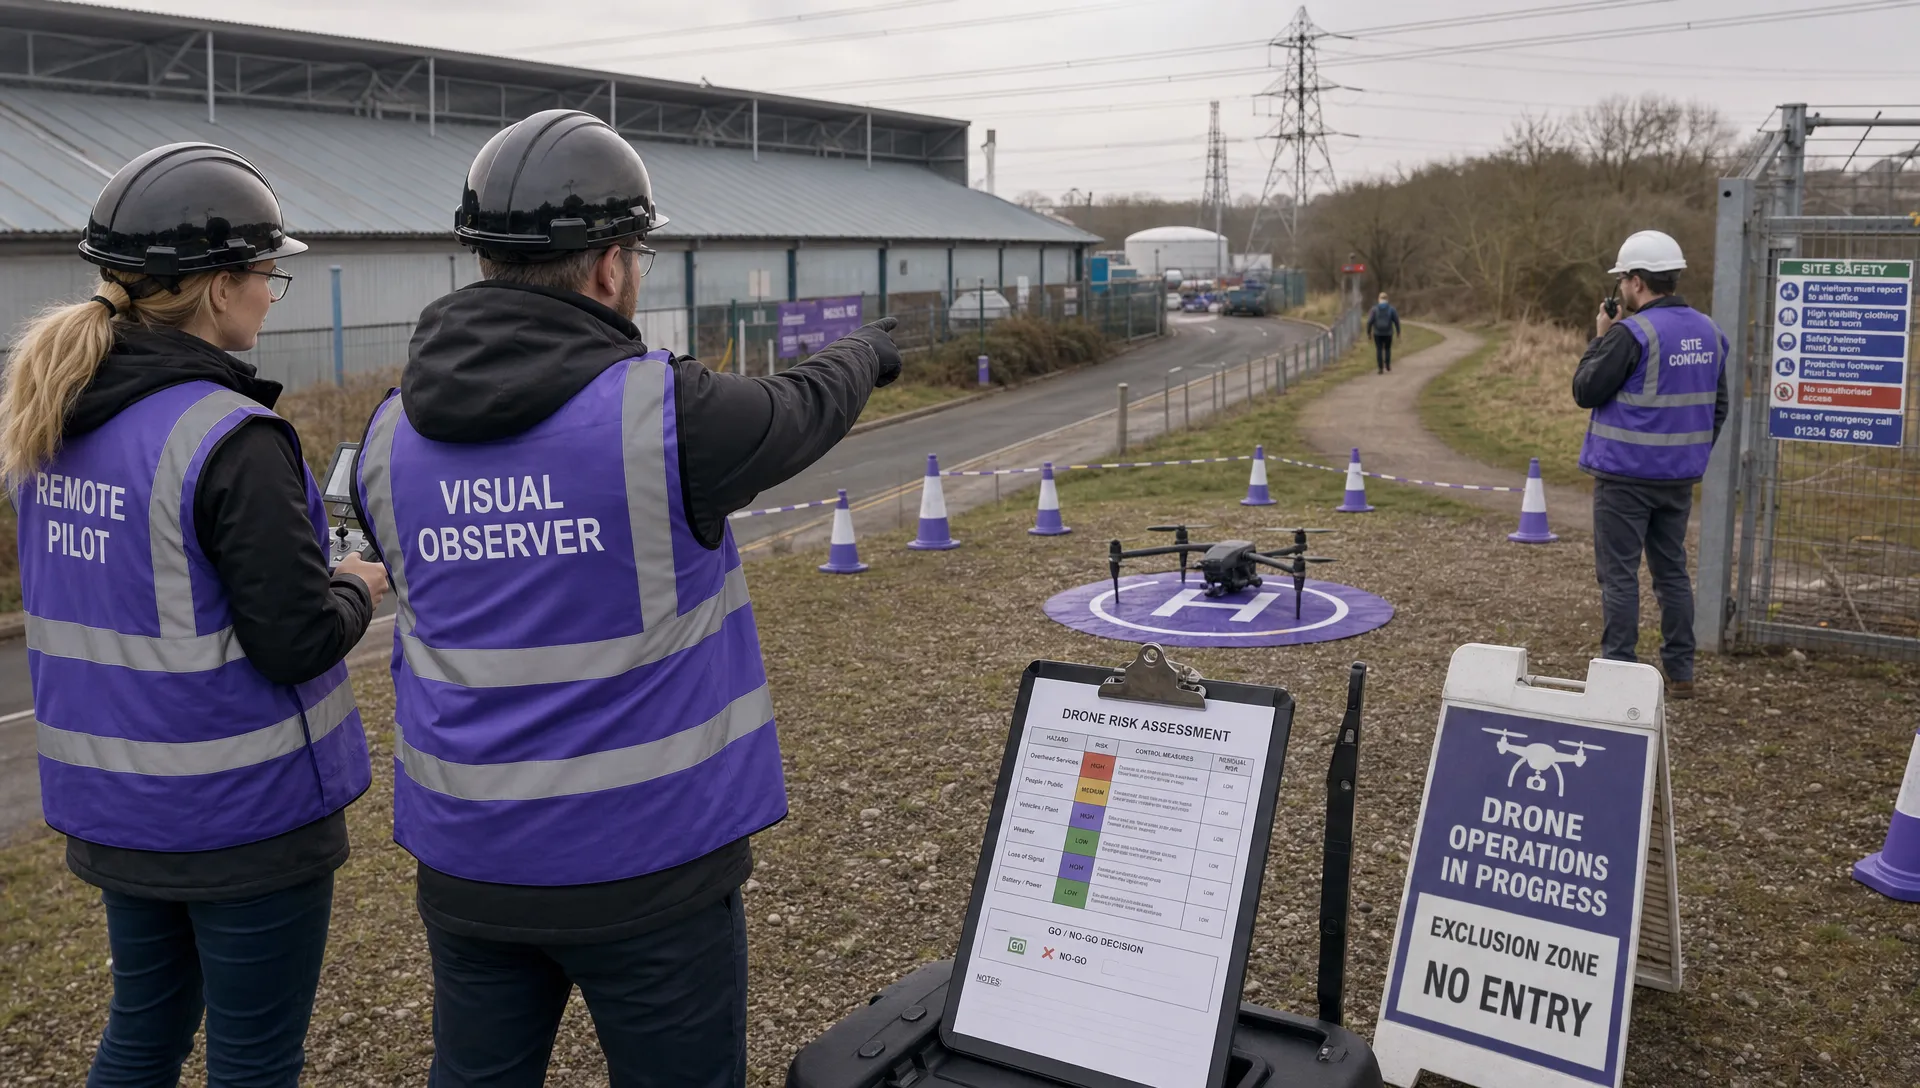 Drone Flight Risk Assessment Example for Safer Missions →
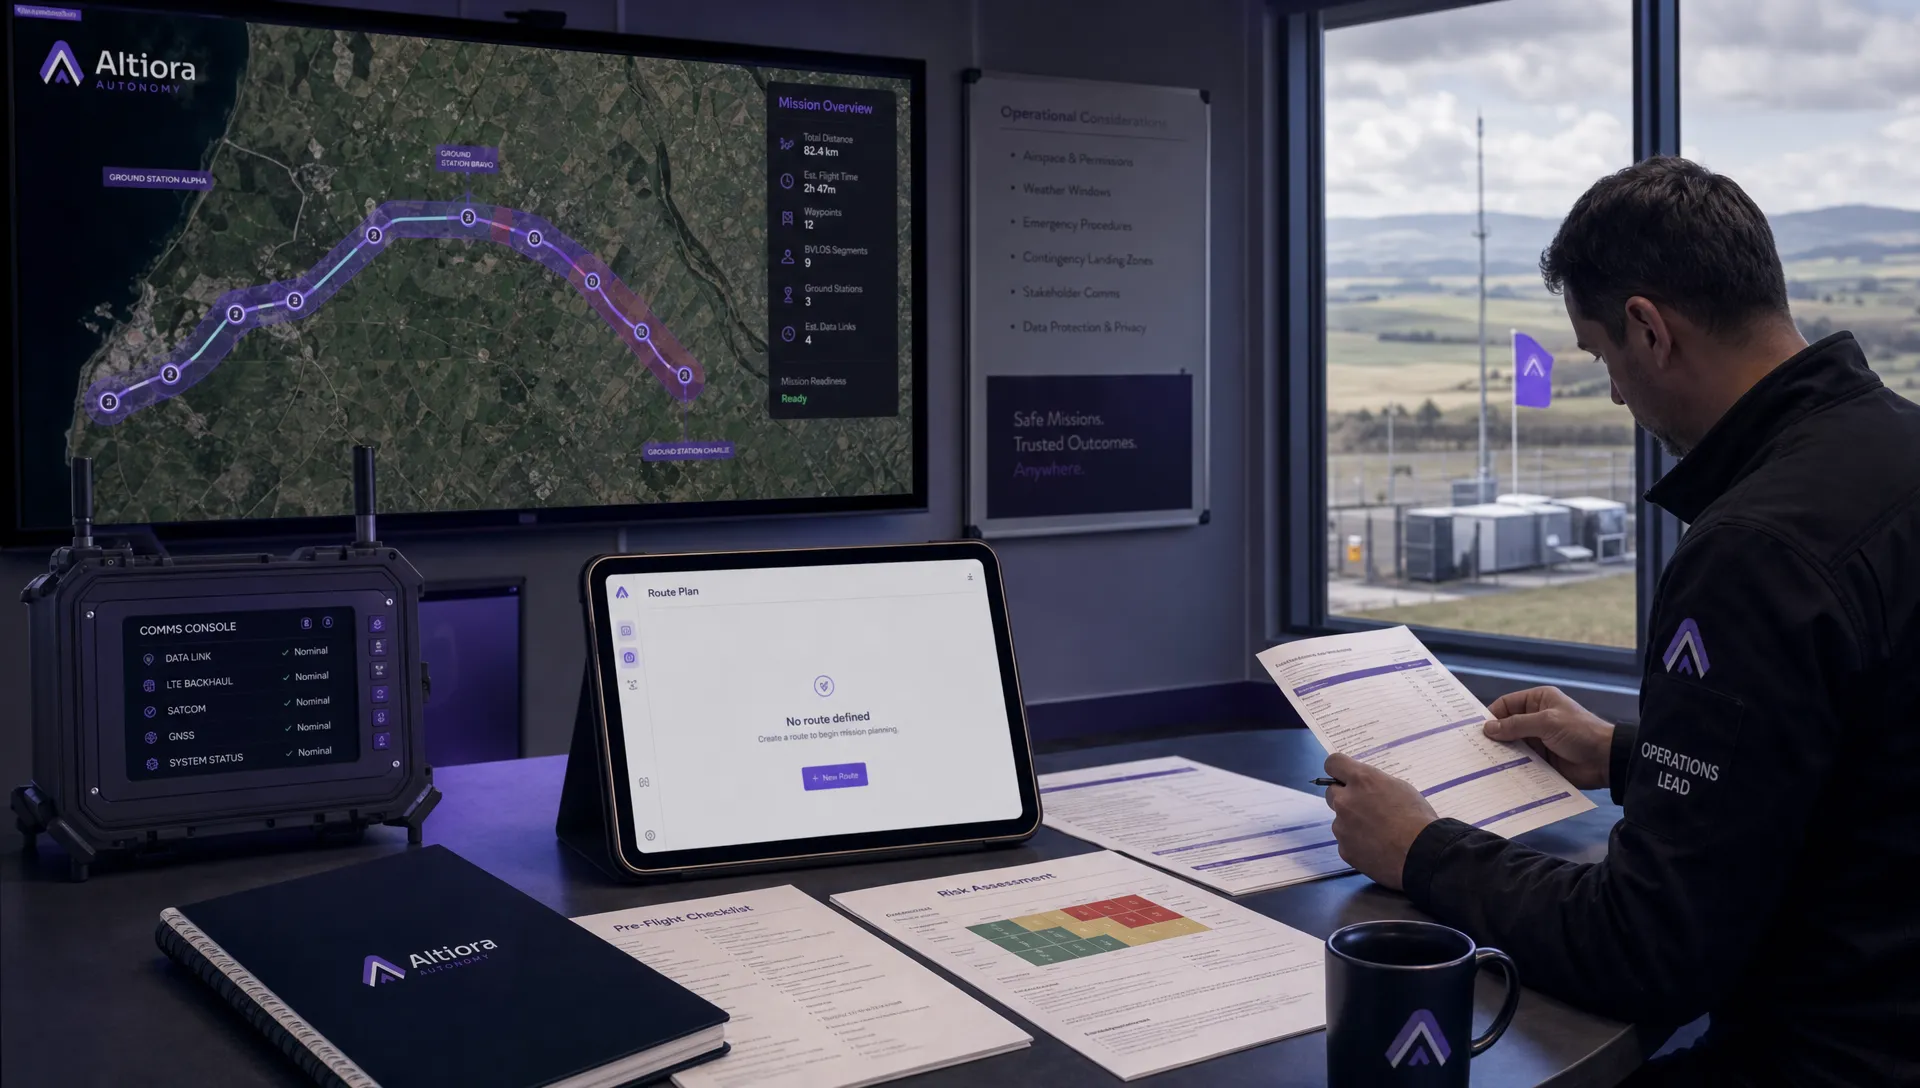 Beyond Visual Line of Sight Explained for Operators →
 How BVLOS Drone Operations Change Commercial Workflows →
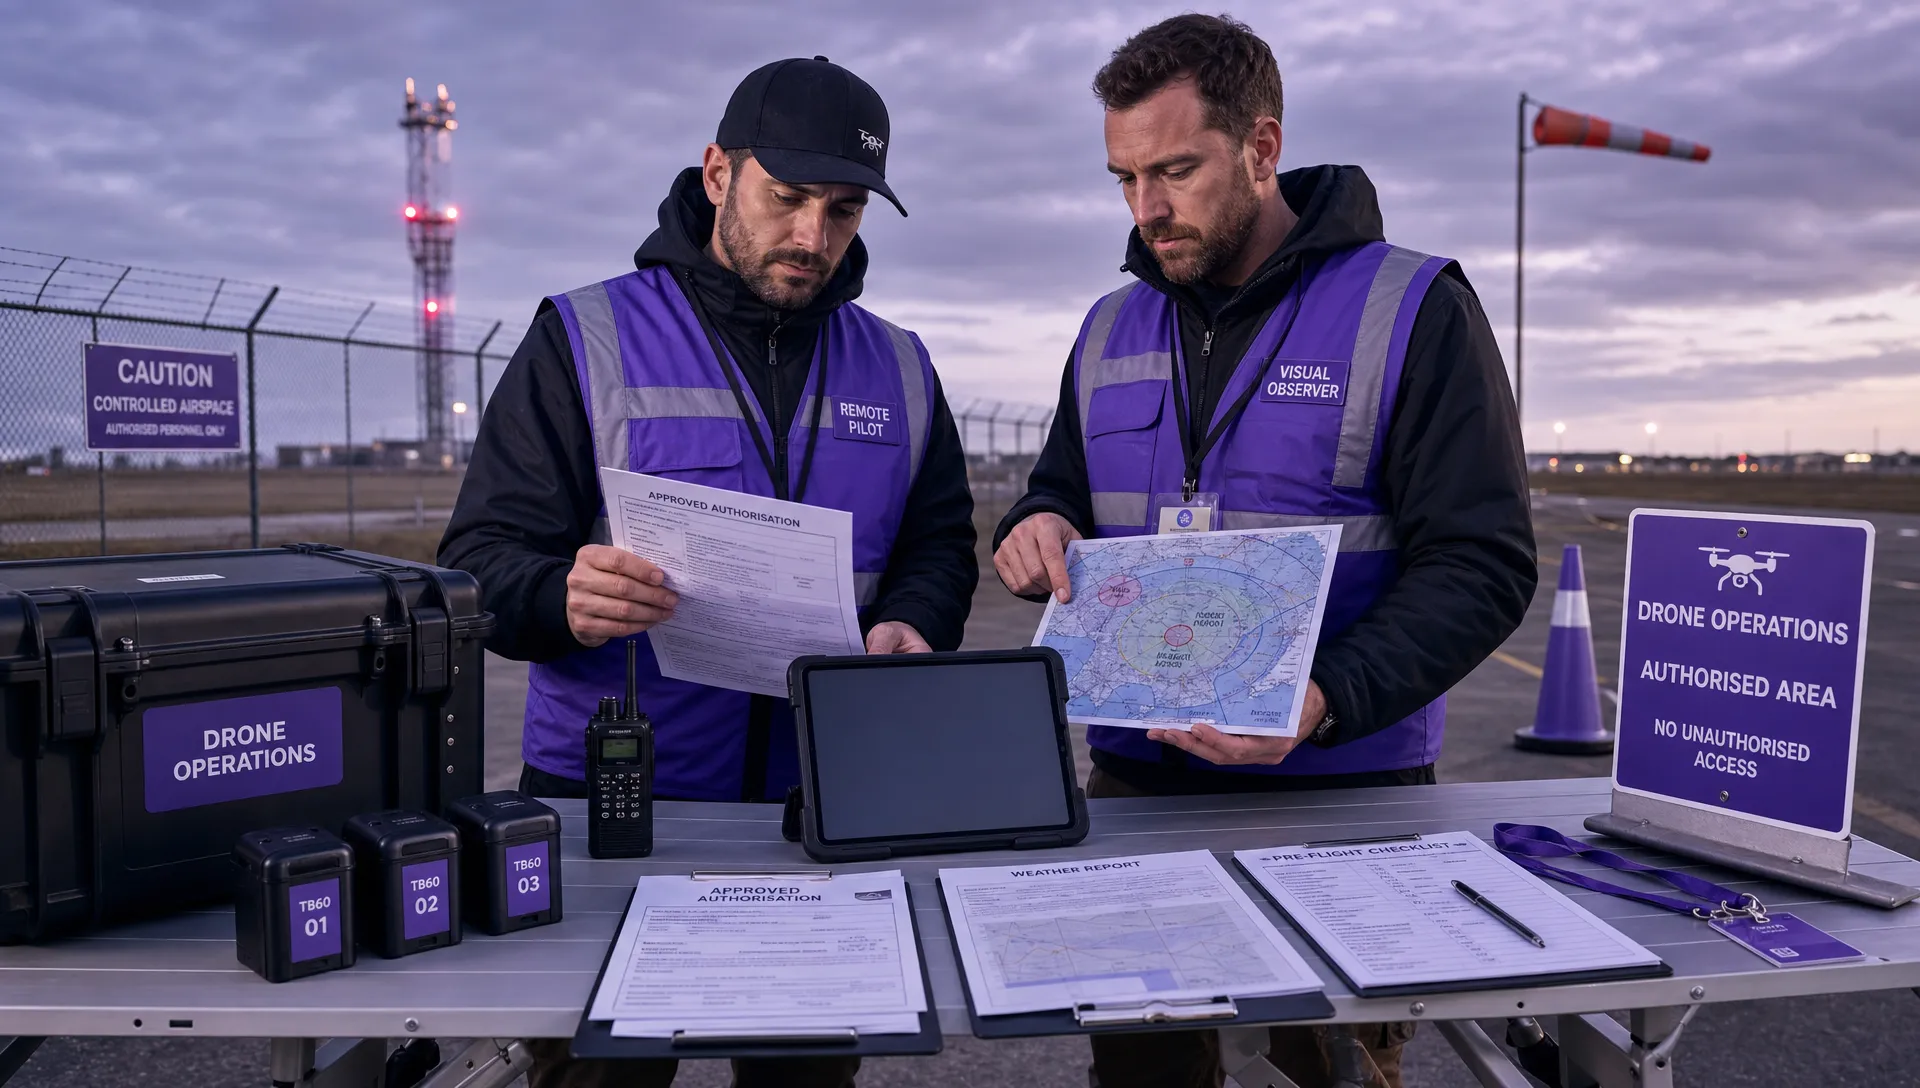 FAA Drone Rules Every Commercial Pilot Should Know →
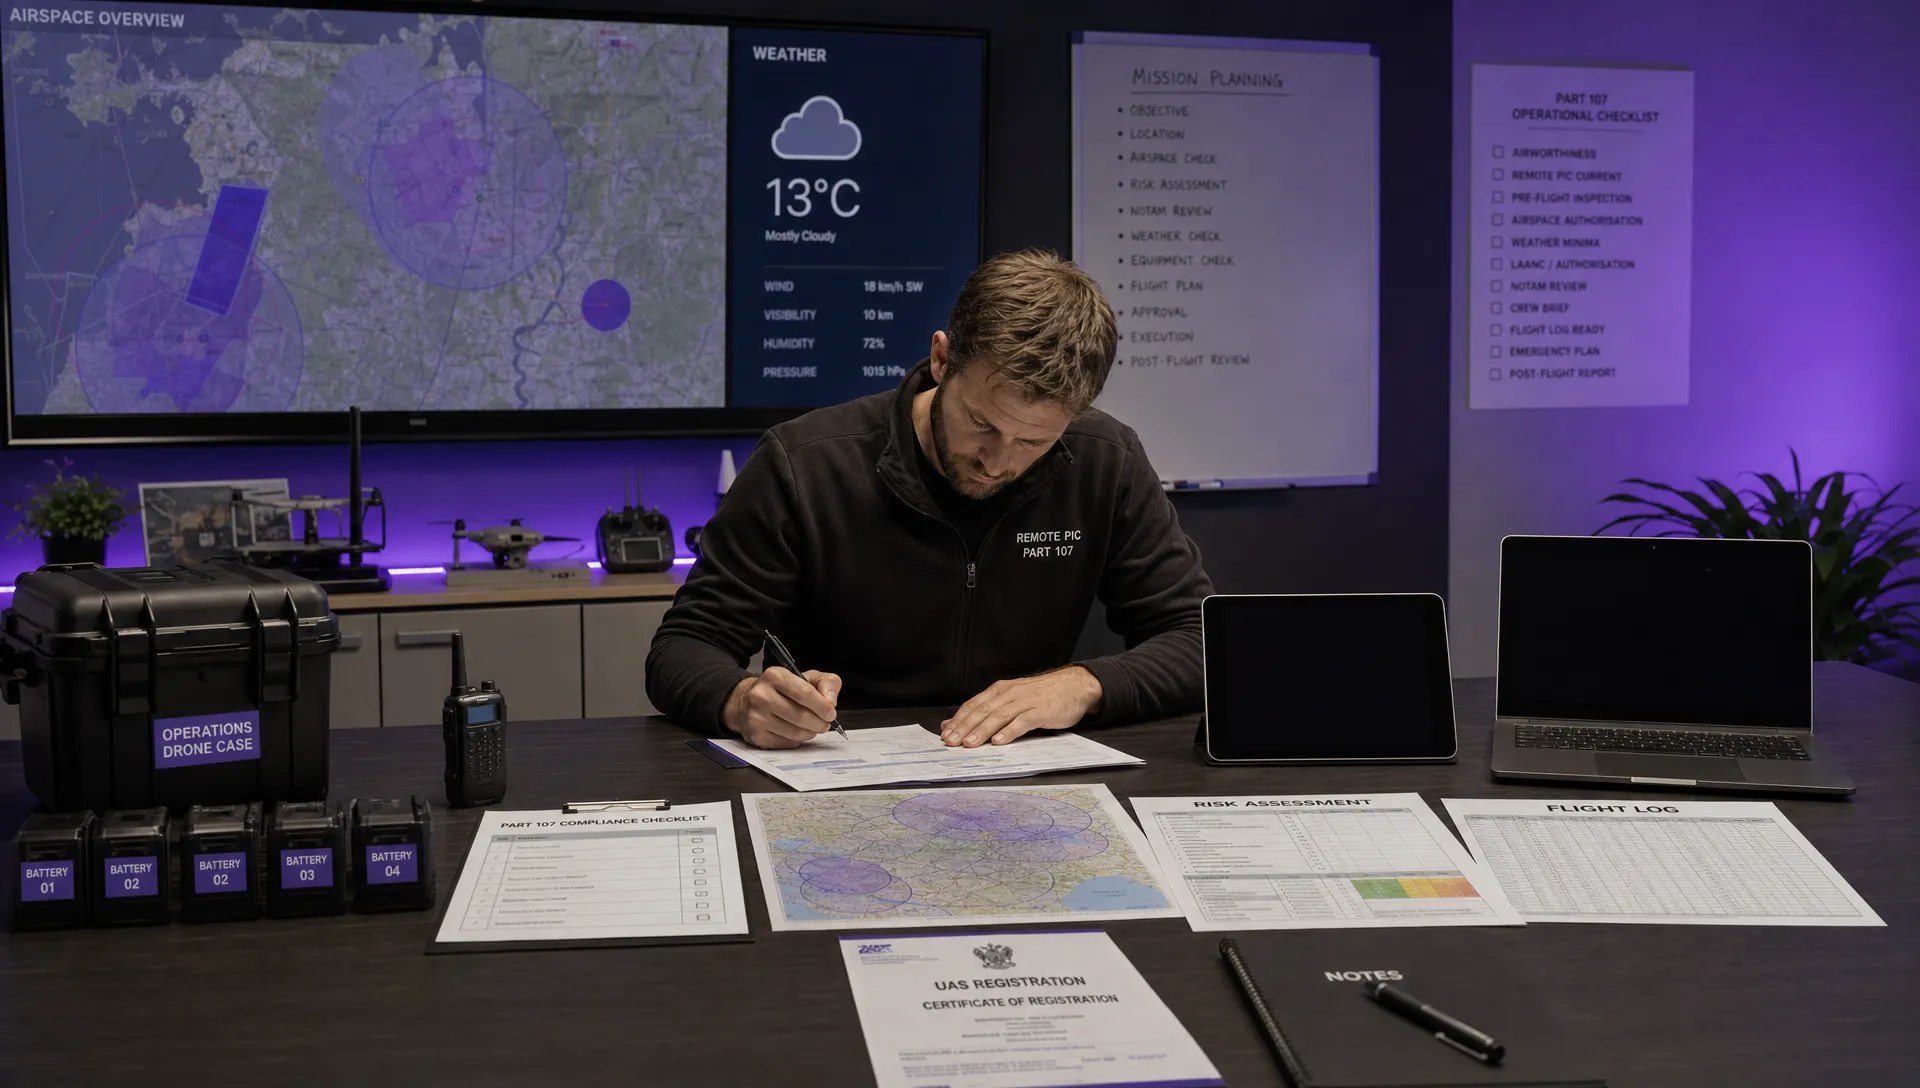 FAA 107 Explained for Commercial Drone Operators →
 Canadian Drone Regulations Explained for Business Use →
 FAA Part 107 Drone License Explained for Beginners →
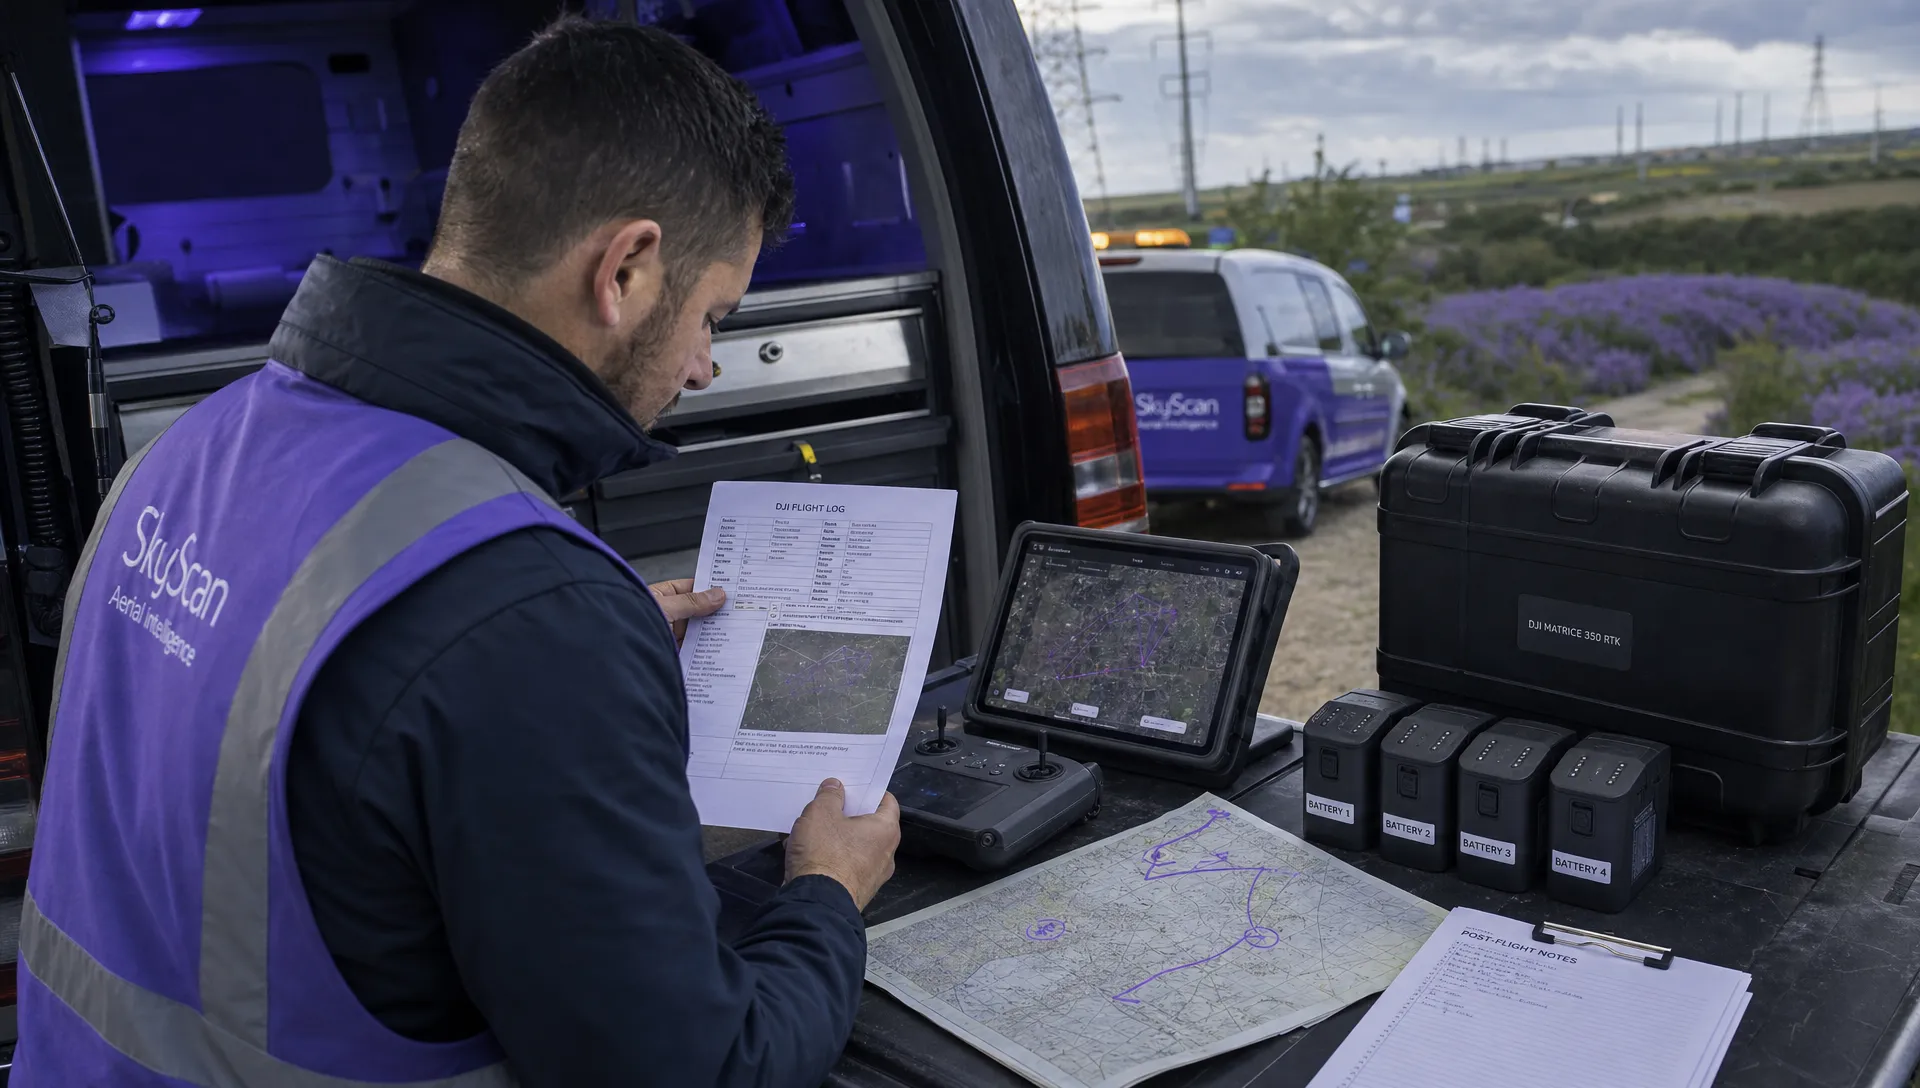 How to Review a DJI Drone Flight Log Step by Step →