How to Read Weather Reports for Drone Flights
Learning to read weather reports for a drone flight isn't just about checking for rain. It’s about translating coded aviation data—things like METAR and TAF—into real-world intelligence that keeps your flights safe and on the right side of the law.
This is the skill that separates the pros from the amateurs. You’ll learn to decode wind speeds, cloud heights, and visibility forecasts, moving far beyond the happy little sun icon on your phone’s weather app.
Why Weather Is Your Most Critical Co-Pilot
Here’s a hard truth for new pilots: flying a drone safely is far more about reading the environment than it is about mastering the controls. Your standard phone app might show a sunny day, but it conveniently leaves out the mission-critical details that professional aviation reports were designed to provide.
For any serious drone pilot, understanding how to read reports like METAR (Meteorological Aerodrome Report) and TAF (Terminal Aerodrome Forecast) is a non-negotiable skill. These aren't just vague predictions; they're precise, data-rich tools that form the backbone of your risk management.
Moving Beyond Basic Forecasts
The gap between a consumer app and a proper aviation report is massive. One is good for planning a picnic; the other is for safeguarding a thousand-dollar asset and ensuring you can actually complete the job you were hired for.
Picture this: you show up for an aerial survey, launch your drone, and then discover the wind gusts at 200 feet are 15 knots higher than the gentle breeze you felt on the ground. That’s a detail your phone app completely missed, and it's a scenario that can quickly lead to an unstable flight, a lost drone, or a failed mission.
This is exactly why professional pilots rely on specialized data. These reports synthesize incredibly complex meteorological information into a standardized, usable format. Meteorologists use everything from ground-based weather stations to satellites to gather raw data, which is then fed into sophisticated prediction models. If you're curious about the science, you can explore more about weather forecasting models on Wikipedia. This whole process is what gives you the detailed, actionable insights needed for safe flight planning.
The real skill of a pilot isn't just flying the drone, but knowing when not to. A misread weather report is one of the most common—and preventable—causes of drone incidents.
Consumer App vs. Aviation Report: What Pilots Need to Know
It's easy to get complacent and rely on the app that's already on your phone. But for professional operations, that's a risk you can't afford to take. The table below breaks down the crucial differences and highlights why pilots depend on aviation-specific reports.
| Feature | Consumer Weather App | Aviation Weather Report (METAR/TAF) |
|---|---|---|
| Wind Data | Shows ground-level speed and a general direction. | Provides precise speed, direction, and gust information (G25KT). |
| Cloud Information | Basic icons (sunny, cloudy). May give a general ceiling. | Details exact cloud layers, height, and coverage (SCT010, BKN025). |
| Visibility | Vague terms like "Hazy" or "Foggy." | Reports precise distance, often in statute miles or meters (3SM, 8000). |
| Forecast Timing | Broad hourly or daily blocks. | Pinpoints specific time windows for changes (TEMPO, BECMG). |
| Data Source | General models for a wide geographic area. | Sourced from airport weather stations for hyper-local accuracy. |
| Intended User | The general public planning daily activities. | Pilots and aviation professionals for operational safety. |
As you can see, the level of detail isn't even comparable. Aviation reports give you the specific data points you need to make informed, safe decisions every time you fly.
The Real-World Impact on Your Operations
Getting good at this directly affects your success and safety. We're talking about more than just dodging a rain shower. It’s about knowing the exact cloud ceiling to ensure you maintain a visual line of sight, or spotting a sudden wind shift predicted in a TAF that could put your return-to-home flight in jeopardy.
Think about these practical scenarios:
- Mission Success: Planning a real estate shoot around a temporary fog bank (
TEMPO FG) means you get crystal-clear shots instead of a completely wasted trip. - Asset Protection: Recognizing a high-gust warning (
G25KT) in the forecast prevents you from flying a drone beyond its operational limits, saving you from a costly crash. - Regulatory Compliance: Seeing a broken cloud ceiling at 1,500 feet (
BKN015) keeps you compliant with FAA regulations that require pilots to stay clear of clouds.
At the end of the day, these weather reports are the foundation of your entire flight plan. They empower you to shift from being a reactive operator into a proactive, strategic pilot.
Decoding the METAR for a Real-Time Weather Snapshot
At first glance, a METAR report looks like a jumble of code or some forgotten alien language. But for a drone pilot, it’s one of the most powerful tools you have. Think of it as a super-precise, live snapshot of the weather conditions at a specific airport. Learning to read these reports is what separates guessing from knowing.
Let's pull apart a real-world example to show you how simple it can be. Once you get the hang of the structure, you’ll be reading any METAR in just a few seconds.
Here’s a typical report:
Example METAR: KLAX 151752Z 25015G25KT 10SM SCT030 18/10 A2992 RMK AO2
That single line tells you everything you need to know right now about the weather at Los Angeles International Airport. Let's dig in.
The Basics: Where and When
Every METAR starts by setting the scene, telling you the location and time the report was pulled. Getting this right is fundamental to everything else.
-
KLAX: This is the four-letter ICAO airport code. In the US, they almost always start with a "K." So,KLAXis Los Angeles International. Knowing your local airport codes is a must. This is also where knowing your way around an aeronautical chart pays off, as they provide all the context for these locations. For a deeper dive, check out our guide on how to read aeronautical charts. -
151752Z: This is your date and time stamp. You read it as the 15th day of the month at 1752 Zulu time (UTC). As a drone pilot, this is the first thing you should check. It ensures you’re working with fresh, relevant data, not some old report from hours ago.
The Critical Stuff: Wind and Visibility
Now we get to the data that directly drives your go/no-go decision. For any drone operation, wind is arguably the most important weather factor you'll face.
In our example, the wind is 25015G25KT. Here’s the breakdown:
250: The wind is blowing from 250 degrees (a west-southwest direction).15: The sustained wind speed is 15 knots.G25: This is the crucial part. It means gusts are hitting 25 knots. This is a detail that many consumer weather apps completely miss, and for a drone pilot, it’s a game-changer. A drone that’s perfectly happy in 15-knot winds could be in serious trouble when a 25-knot gust comes through.KT: This just stands for "knots," the standard unit for speed in aviation.
Right after the wind, you'll see 10SM. This means visibility is 10 Statute Miles—crystal clear and well above the 3-statute-mile minimum required for Part 107 flights. If the weather was turning sour, you might see 3SM (3 statute miles) or even 1/2SM (half a statute mile).
A key takeaway for drone pilots is to always plan for the gusts, not the sustained wind speed. Your drone’s stability is only as good as its ability to handle the strongest burst of wind it encounters.
The Bigger Picture: Clouds and Conditions
The next section of the METAR paints a picture of the sky above, which is vital for maintaining a visual line of sight (VLOS) and staying on the right side of regulations.
Our example shows SCT030. This is the cloud cover report:
SCT: This stands for Scattered clouds. Cloud cover is measured in eighths of the sky, andSCTmeans 3/8 to 4/8 of the sky has clouds.030: This number tells you the cloud base in hundreds of feet above ground level (AGL). So,030means the clouds are sitting at 3,000 feet AGL.
This SCT030 report tells us there are some clouds around, but they're high up with plenty of blue sky in between. A great day for flying.
You’ll run into other cloud codes, too:
- FEW: Few clouds (1/8 to 2/8 coverage)
- BKN: Broken clouds (5/8 to 7/8 coverage). This is considered a legal ceiling.
- OVC: Overcast (8/8 coverage). Also a ceiling.
If you saw BKN015, you'd be looking at a much different day—a broken ceiling at 1,500 feet AGL. That requires careful planning to make sure your drone stays well below that cloud base.
Finally, we have 18/10 and A2992:
18/10: This is the temperature (18°C) and dew point (10°C). The closer these two numbers are, the higher the chance of fog or low clouds forming.A2992: This is the altimeter setting, or barometric pressure, measured in inches of mercury (29.92 inHg). While critical for manned aircraft, it's also useful for calibrating your drone’s onboard sensors.
By breaking it down like this, that confusing string of characters becomes a clear, actionable weather briefing. It tells us that at LAX, the winds are manageable but gusty, visibility is perfect, and the clouds are high and scattered at 3,000 feet. Looks like good conditions to fly.
Using the TAF to Plan Your Flights Like a Pro
If a METAR report gives you a real-time snapshot of the weather right now, the Terminal Aerodrome Forecast (TAF) is your crystal ball for the next 24 to 30 hours. This is the ultimate tool for strategic planning. It lets you move from just reacting to the weather to proactively scheduling your operations around it with confidence.
Frankly, mastering the TAF is what separates the pros who avoid costly, last-minute cancellations from those who seem constantly surprised by a sudden squall.
Let's say you've got a crucial three-hour aerial mapping job booked for tomorrow morning. The TAF is what will help you pinpoint the safest wind window, see deteriorating conditions coming, and make a smart go/no-go decision long before you even start charging batteries.
Anatomy of a TAF Report
At first glance, a TAF looks like a jumbled mess of code, much like a METAR. But it follows a similar structure while adding new elements for timing and change. It might seem intimidating, but once you crack the logic, it becomes an incredibly powerful planning tool.
Here's a sample TAF we can pull apart:
KLAX 151130Z 1512/1618 14008KT P6SM SKC
FM151500 25015G25KT P6SM FEW040
TEMPO 1520/1523 4SM -SHRA BKN030
FM160400 VRB04KT P6SM SKC
This single forecast tells a detailed story about how the weather is expected to evolve over a full day at Los Angeles International Airport.
Decoding the Initial Forecast Period
The first line of the TAF sets the scene. It establishes the baseline conditions for the very start of the forecast period, before any big changes are expected.
KLAX 151130Z: Just like a METAR, this is the airport code (KLAX) and the time the report was issued (the 15th day of the month at 1130 Zulu).1512/1618: This is the all-important validity period. The forecast is valid from the 15th at 1200Z until the 16th at 1800Z. In this case, it’s a 30-hour forecast window.14008KT P6SM SKC: Here’s our baseline forecast. It’s predicting winds from 140 degrees at a gentle 8 knots, visibility greater than 6 statute miles (P6SM), and sky clear (SKC).
So, right off the bat, this tells you that for the first few hours of the forecast, conditions are looking calm and clear. An excellent start.
Understanding Change Indicators
The real magic of a TAF lies in its change indicators. These are the codes that tell you when and how the weather is predicted to shift. The three you’ll see most often are FM, BECMG, and TEMPO.
The FM Group (From)
Think of the FM group as a hard stop. It signifies a rapid and significant change. When you see FM, it means the previous forecast is completely wiped and replaced by the new one, starting at that exact time.
In our example, we see:
FM151500 25015G25KT P6SM FEW040
Let's translate that:
- From (
FM) the 15th day at 1500Z, the weather will permanently change. - Winds will swing around to 250 degrees and pick up to 15 knots, with gusts kicking up to 25 knots.
- Visibility stays great (
P6SM), but a few clouds will start popping up at 4,000 feet (FEW040).
This is a critical update for any drone pilot. That calm morning is forecasted to turn into a windy, gusty afternoon. Knowing this, you’d schedule your flight before 1500Z to avoid those challenging conditions. Keeping on top of these shifts is just as crucial as checking your flight area against FAA facility maps for airspace restrictions.
A
FMindicator is a hard line in the sand. It signals a definitive shift in the weather pattern, making it one of the most important elements for scheduling your flight windows.
The TEMPO Group (Temporary)
The TEMPO group forecasts temporary fluctuations. These are conditions expected to last for short periods—usually less than an hour at a time—and they won't affect more than half of the forecast window they're listed in.
Our TAF includes:
TEMPO 1520/1523 4SM -SHRA BKN030
Here’s what that means:
- Temporarily (
TEMPO), between 2000Z and 2300Z on the 15th... - ...conditions might include a drop in visibility to 4 statute miles (
4SM), light rain showers (-SHRA), and a broken cloud ceiling at 3,000 feet (BKN030).
This is your big yellow flag. It doesn't mean it will be raining for three hours straight, but it warns you of potential pop-up showers during that window. For a drone pilot, this is a clear signal to avoid that timeframe entirely or, at the very least, be ready to land in a hurry.
Bringing It All Together for a Flight Plan
The final line, FM160400 VRB04KT P6SM SKC, shows things calming down again after 0400Z on the 16th, with light, variable winds and clear skies. By reading the entire TAF from start to finish, you can build a complete operational timeline for your mission.
Here’s how we’d plan our day based on this TAF:
- Early Morning Window (1200Z - 1500Z): Ideal. Winds are light (8 knots), skies are clear. This is our prime time to get the job done.
- Afternoon (1500Z - 2000Z): Challenging. The wind picks up in a big way, with gusts to 25 knots. This is likely a no-go for most commercial drones.
- Late Afternoon (2000Z - 2300Z): High Risk. The gusty winds are still around, but now we're adding a chance of rain and low clouds. Definitely a no-fly window.
- Overnight (After 0400Z): Excellent. Conditions become calm again. Good for any potential night operations.
This predictive power is something we often take for granted. Weather forecasting has come a long way since the UK issued its first forecasts for shipping back in the 19th century. Today, thanks to powerful computer models, the Met Office says its four-day forecasts are as accurate as its one-day forecasts were just 30 years ago. By learning to use the TAF, you’re tapping into one of the most refined and powerful planning tools available to any pilot.
Advanced Weather Data That Impacts Drone Performance
If you’ve nailed reading wind, visibility, and cloud reports, you’re already way ahead of most drone pilots. But the truly exceptional operators—the ones who seem to have a sixth sense for flight conditions—know how to dig deeper. They look for the subtle details that directly hammer your drone’s physical performance, battery life, and overall stability.
This is about moving beyond just following the rules and starting to really understand the flight environment. We're talking about interpreting how things like temperature, humidity, and air pressure combine to affect your aircraft, letting you spot problems before they even happen.
Predicting Fog with Temperature and Dew Point
One of the most powerful, yet often overlooked, pairings in any METAR report is the temperature and dew point. In the 18/10 example from earlier, the first number is the temperature (18°C), and the second is the dew point (10°C). The dew point is simply the temperature where the air gets completely saturated, causing water vapor to condense into fog, mist, or low clouds.
Here’s the critical part: when these two numbers get close—usually within 2-3°C of each other—it's a massive red flag. This small gap, known as the "spread," means humidity is sky-high, and there's a serious risk of your visual line of sight vanishing in a blanket of fog. This is a mission-critical insight that your standard weather app will almost never give you.
Picture this: you're planning an early morning shoot. The forecast looks clear, but the temperature/dew point spread is just one or two degrees. With that knowledge, you can predict that fog is almost guaranteed to form as the ground cools overnight. Now you can delay your start time, saving yourself a wasted trip to a completely socked-in location.
Why Density Altitude Matters for Performance
Density altitude is easily one of the most misunderstood concepts for drone pilots, but it's vital, especially if you fly in hot climates or at high elevations. It has nothing to do with your actual height. Instead, it’s a measure of air density—and that density directly impacts how well your drone flies.
Think of it like this: your props generate lift by grabbing onto air molecules. On a hot, humid day or high up in the mountains, the air is less dense. Fewer air molecules mean less for the props to "bite" into.
This "thinner" air forces your drone's motors to work a whole lot harder just to stay airborne. The consequences of high density altitude are very real:
- Shorter Flight Times: Your motors have to spin faster, which torches your battery. A flight that normally gets you 25 minutes could be slashed to 20 minutes or less.
- Sluggish Controls: The drone will feel less responsive and might struggle to hold its position, especially if there's any wind.
- Reduced Lifting Power: Your aircraft’s ability to carry a payload drops. This is huge for anyone flying heavy cinematic cameras or survey equipment.
Density altitude is the invisible force that can ground your drone on a hot summer day. Always remember that high temperatures and high elevations create a double-whammy for performance, demanding shorter flights and more cautious maneuvering.
Understanding the Altimeter Setting
The final advanced metric to check is the altimeter setting, shown as A2992 in our example. This is the barometric pressure in inches of mercury (29.92 inHg). While your drone's GPS is the primary source for its altitude, the internal barometer uses air pressure to fine-tune that data and measure its height relative to the takeoff point.
For a pilot, the real value here is tracking the trend. A rapidly dropping pressure usually signals an approaching low-pressure system, which almost always brings lousy weather like strong winds and rain. By noting the altimeter reading before you fly and comparing it to later reports, you get a feel for the atmospheric trend. It's a subtle but powerful way to confirm if conditions are getting better or worse, adding another layer of confidence to your go/no-go decision.
A Real-World Flight Planning Walkthrough
Theory is one thing, but putting it all into practice is where your skills as a pilot really shine. Let’s walk through a complete, real-world flight planning scenario to see how all these pieces fit together. This is exactly how you can use weather reports to make safe, efficient decisions on the ground.
Our mission: A commercial rooftop inspection scheduled for tomorrow afternoon near a local airport.
TAF Analysis for Strategic Planning
First things first, I'm pulling the TAF for the closest airport. This gives me the long-range forecast I need to start thinking about the best potential flight window.
TAF KXYZ 151145Z 1512/1618 13008KT P6SM SKC
FM151500 24012G22KT P6SM SCT040
BECMG 1602/1604 18005KT P6SM SKC
So, what story is this TAF telling me for tomorrow's job?
- 1200Z to 1500Z: Conditions are looking perfect. We’re talking 8-knot winds and clear skies. This would be a dream morning window, but my job isn't until the afternoon.
- From 1500Z: This is where it gets interesting. A big shift is coming. Winds are forecast to swing around to 240 degrees and pick up to 12 knots, with gusts hitting 22 knots. That’s smack in the middle of our planned flight time.
- Overnight (After 0200Z): Things calm right down again to a gentle 5 knots.
Based on this, it's clear tomorrow afternoon is going to be windy. A 22-knot gust is pushing the operational limits for many commercial drones. My immediate takeaway is that I need to be extremely cautious and keep a very close eye on the live conditions on the day.
I'll log this initial assessment in my planning software. Using comprehensive drone flight planning software is great for documenting this kind of risk assessment from the get-go.
Monitoring METARs on Flight Day
Fast forward to the day of the inspection. My focus now shifts from the TAF to the hourly METAR reports. These are my live snapshots—they’ll tell me if the forecast is holding true or if things are changing faster than predicted.
1353Z METAR: KXYZ 151353Z 14009KT 10SM SKC 17/09 A3001
This report confirms the morning is calm, just as the TAF predicted. No surprises yet.
1453Z METAR: KXYZ 151453Z 23011G20KT 10SM SCT040 19/09 A3000
And there it is. The wind shift has arrived, right on schedule. I’m now seeing sustained winds of 11 knots with gusts popping up to 20 knots. The forecast was spot on.
This kind of live data is invaluable for making the right call. It’s a good moment to appreciate how far weather prediction has come since the first numerical forecast was painstakingly crunched on the ENIAC computer back in 1950.
To get a better handle on weather maps in general, this kind of infographic can be a huge help for quickly deciphering the key visual elements.
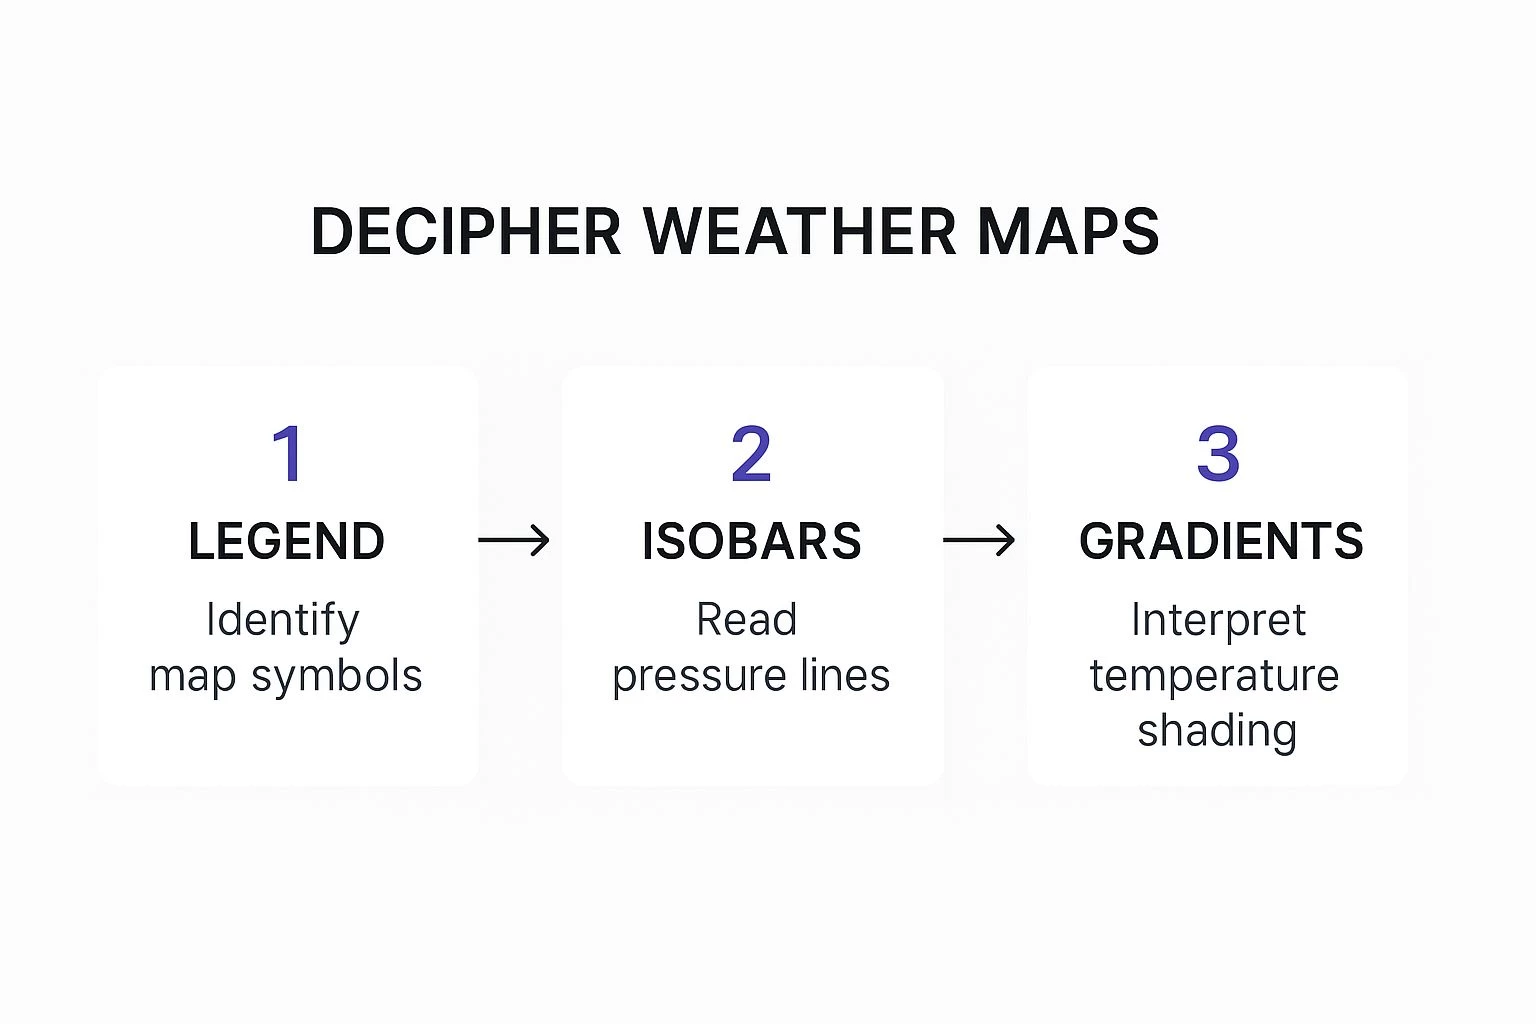
It’s a great reminder that interpreting weather data is all about piecing together symbols, pressure lines, and temperature gradients to build a complete picture of what's happening.
Making the Go/No-Go Call
Now for the final decision. The METAR confirms the gusty conditions the TAF warned me about. While the sustained winds might be manageable, those 20-knot gusts are a real problem, especially for a rooftop inspection that demands precision and stability.
The Decision: With these gusty conditions, the only safe call is to postpone the flight. The risk of the drone behaving erratically so close to a structure is just too high. It's time to contact the client and reschedule for the following morning when the TAF predicts much calmer winds.
When you're outlining a flight plan, knowing how to react to challenging weather is absolutely critical. In more extreme cases, organizations even develop detailed severe weather response playbooks to manage risk.
This whole process—using the TAF for long-range planning, the METAR for real-time validation, and combining both to make a safe, professional judgment call—is the cornerstone of responsible drone operations.
Drone Weather Reports: Your Questions Answered
Even after you've got the basics down, a few practical questions always pop up when you're out in the field. Let's tackle some of the most common ones I hear from other drone pilots. Think of this as the real-world advice that helps you move from just reading the reports to truly understanding them.
What Are the Best Apps for METAR and TAF Reports?
While you can find weather on a million consumer apps, professional pilots stick to tools built for aviation. The gold standards are ForeFlight and Garmin Pilot. They're not just apps; they're complete flight planning systems that bake weather briefings right into your workflow. It’s a huge time-saver and keeps everything in one place.
If you're looking for great free options, you can't beat the source. AviationWeather.gov, run by NOAA, gives you the raw and translated reports directly. Many of the drone-specific apps we all use, like B4UFLY and Aloft, have also started pulling in this essential aviation data, which makes it super convenient to check during your pre-flight routine.
How Often Are Weather Reports Updated?
This is a critical one. Using outdated info is a rookie mistake. The two main reports you’ll be using operate on very different schedules.
- METARs: These are your hourly check-ins, usually issued between 50 and 55 minutes past the hour. But here's the key part: if conditions change suddenly, a SPECI (Special Report) can be issued at any time. Always watch for those.
- TAFs: These are the long-range forecasts, so they're updated less frequently. They come out four times a day, every six hours, at 0000, 0600, 1200, and 1800 UTC. Get in the habit of always checking the issuance time to make sure you're looking at the latest forecast.
What Is the Real-World Difference in Cloud Cover?
This isn't just about whether it's sunny or not; this has massive legal and safety implications for us.
For drone pilots, the difference between 'Scattered' and 'Broken' is the difference between an open sky and a legal ceiling. Understanding this is non-negotiable for staying compliant and maintaining visual line of sight.
Let’s quickly break down what these codes mean for you:
- SCT (Scattered): The sky is 3/8 to 4/8 covered. You've got plenty of blue up there. This is generally a great day for flying.
- BKN (Broken): Now we're at 5/8 to 7/8 coverage. This is officially a ceiling. Your drone must stay well below this layer.
- OVC (Overcast): The sky is completely socked in. This is also a ceiling and can often mean poor lighting for any photo or video work.
Knowing the difference is absolutely vital for maintaining visual line of sight (VLOS) and staying clear of clouds, just like the regulations demand.
Is It Safe to Fly During a TEMPO Condition?
When you see TEMPO (Temporary) in a TAF, think of it as a yellow flag, not necessarily a red one. It’s the forecast's way of saying, "Hey, for short periods—less than an hour at a time—things might get a little wild." For example, a TAF predicting TEMPO ... 30KT is a heads-up about potential short-lived, but powerful, wind gusts.
Whether you fly is a judgment call. It all comes down to your drone's limits and, frankly, your own skill and comfort level. The most conservative and safest approach? Plan your flight to avoid that TEMPO window altogether. If you absolutely have to fly, you need to be ready to bring the drone home in a hurry if those conditions pop up.
Ready to stop juggling spreadsheets and start planning flights with professional-grade tools? Dronedesk integrates flight planning, risk assessments, and compliance checks into one seamless platform, giving you more time to fly and less time on paperwork. Try Dronedesk today and see how it transforms your operations.
 FAA Unmanned Aircraft Regulations Made Simple →
 Part 107 Test Tips to Pass With Confidence →
 How to Pass the FAA Drone Written Test First Time →
 What a BVLOS Flight Means for Risk and Compliance →
 Drone VLOS Rules Explained for Commercial Teams →
 FAA Remote ID Rule Explained for Commercial Pilots →
 Drone Legal Requirements for Commercial Operations →
 Drone Near Airport Rules Explained for Safer Planning →
 International Drone Regulations Every Global Team Should Know →
 Drone Flight Risk Assessment Example for Safer Missions →