Turn Drone Data Into Profit With a Plan for Data Analysis
A solid plan for data analysis is what really separates a hobbyist from a profitable drone business. It’s the bridge between a successful flight and a happy, paying client—turning all that raw data into something with real business value.
Why Your Plan for Data Analysis Drives Profit
Let's be honest, flying the drone is the fun part. The real money, though? That's made in the analysis. This isn't just about collecting terabytes of data; it's about turning those pixels and point clouds into clear, actionable insights that solve a client's problem. A structured plan is the framework that makes this happen, project after project.

Without a plan, you're looking at disorganized files, inconsistent results, and countless hours wasted reprocessing data. With one, you’re building a repeatable, scalable system that guarantees every deliverable looks professional and is genuinely valuable.
From Data Chore to Strategic Asset
Your plan is what lets you stop treating data as a technical chore and start using it as a strategic asset. A well-thought-out approach makes even the most complex analysis manageable and predictable. It means you know exactly what you need to deliver before you even take off.
This proactive mindset pays off in several big ways:
- More Efficiency: You cut out the guesswork and rework by standardizing your workflow.
- Happier Clients: You deliver consistent, high-quality results that directly solve their problems.
- Better Profitability: You complete projects faster and can justify premium pricing for the insights you provide.
This shift is crucial, especially with the global drone market projected to hit $96.38 billion in 2026. That kind of growth means more competition, and standing out is everything.
Your data analysis plan turns a one-off flight into a scalable business service. It’s the blueprint for how you create and deliver value, ensuring every report, model, or map has a direct impact on your client's bottom line.
To really tap into this profit potential, think about how your analysis helps your client succeed. For instance, providing precise data can help a contractor win more bids. Integrating advanced Drone Inspection Services can give them a faster, more accurate way to price jobs. This is where a platform like Dronedesk becomes the anchor for your whole operation, connecting every step from flight planning right through to the final report and invoice.
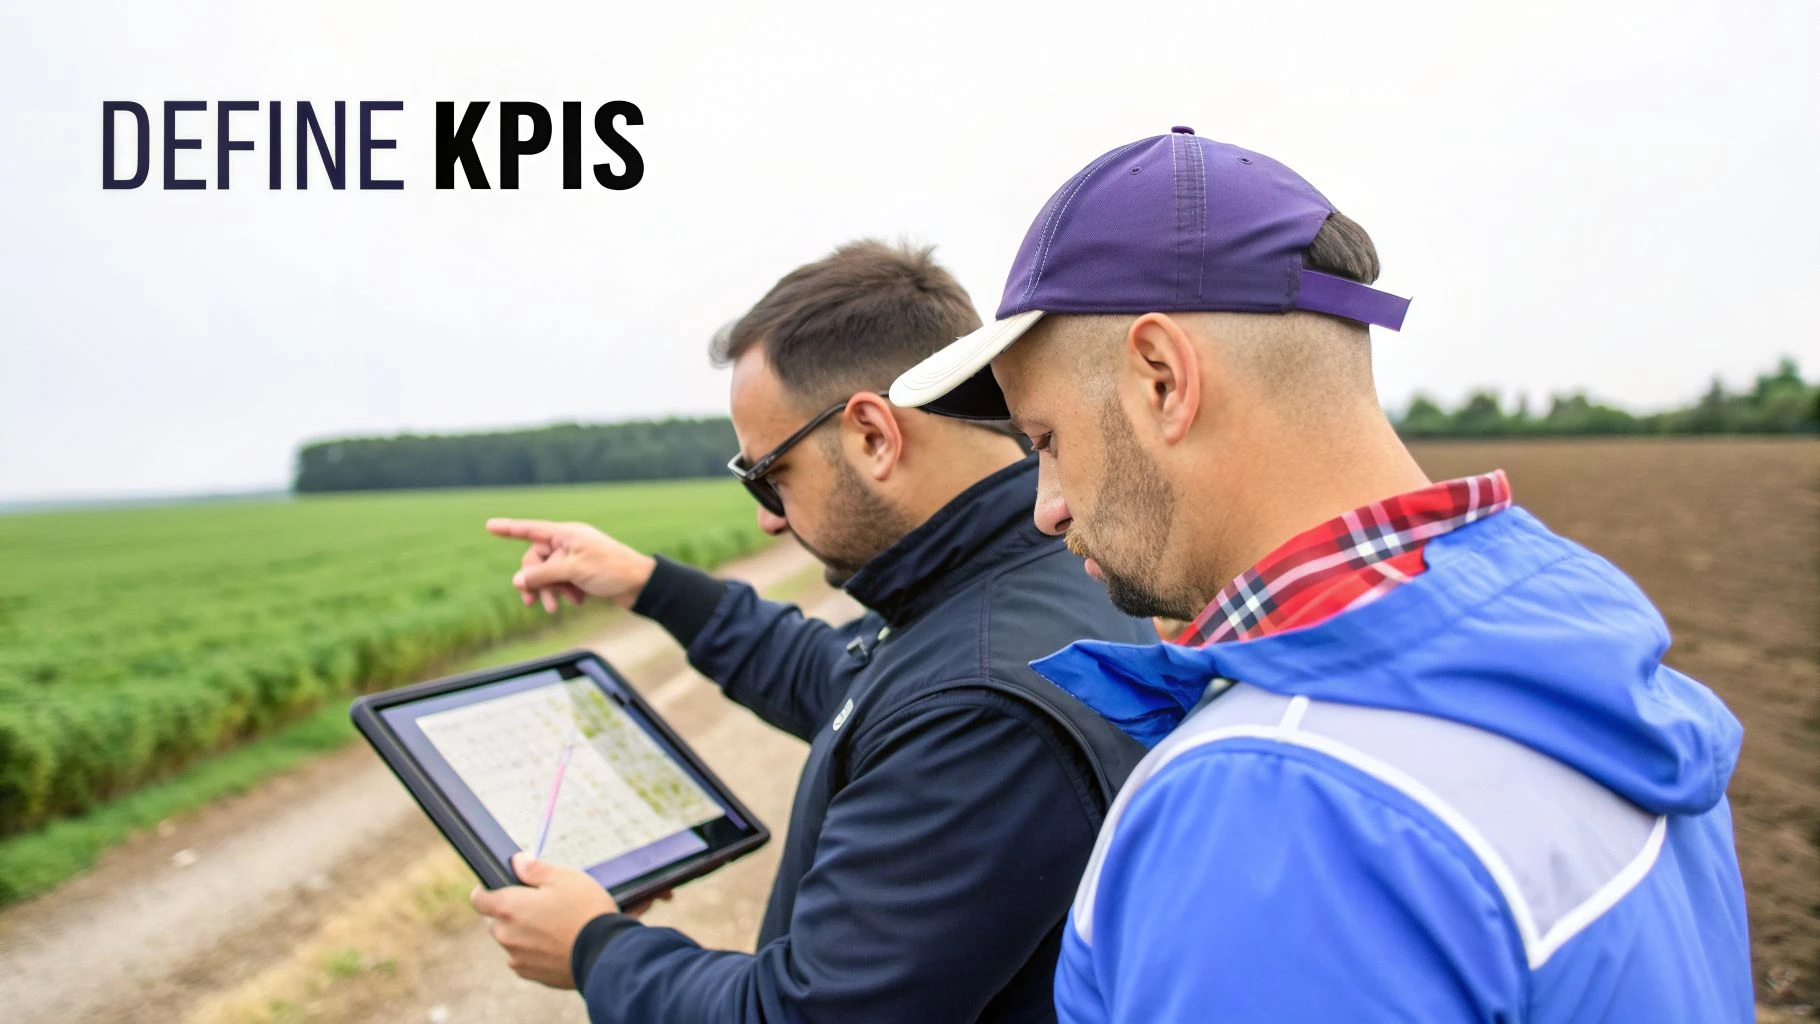
Defining Your Client's Objectives and KPIs
Any successful data analysis plan gets started long before your drone ever leaves the ground. It all begins with a simple conversation. The real goal here is to get past a vague client request, like "survey my farm," and nail down a specific, valuable objective that solves an actual business problem.
This means you have to ask the right questions right from the start. Don't just accept a broad task. You need to dig in and find the core issue the client is trying to solve. Are they trying to boost their yield, cut costs, or maybe just stay compliant with regulations? Each of those answers points you toward a different kind of data and a totally unique way of analyzing it.
For example, that farmer's request to "survey my farm" could be refined into a much clearer objective: "Pinpoint all nitrogen-deficient zones over 2 square meters in cornfield Sector B." A specific goal like this immediately tells you what data you need (multispectral imagery), where you need to fly (Sector B), and what the final report needs to show.
From Vague Requests to Specific KPIs
Turning those high-level objectives into measurable metrics, or Key Performance Indicators (KPIs), is the single most important part of this initial stage. KPIs are the hard, quantifiable targets that tell you what success looks like. They make sure you and your client are on the same page about what a "good" outcome actually is.
Let's break it down with a few real-world examples I've seen across different industries:
- Construction: A client needs a stockpile audit to verify their inventory. A weak KPI is just "a 3D model of the stockpiles." A much stronger, more valuable KPI is "Volumetric accuracy of +/- 2% compared to traditional ground surveys."
- Agriculture: A vineyard owner wants to get a handle on their irrigation. The objective is to find water-stressed vines. The KPI could be to "Identify and map all areas with a Normalized Difference Vegetation Index (NDVI) value below 0.6."
- Inspection: A civil engineer needs a bridge inspection to find potential structural problems. A really powerful KPI would be the "Detection and annotation of all cracks wider than 2mm on the bridge's support columns."
A great data plan isn't about collecting the most data; it's about collecting the right data to answer a specific question. Defining clear KPIs is how you focus your entire operation on what truly matters to the client.
This whole process of hammering out objectives and KPIs should be documented directly within your job planning software. You're building the foundation for the entire project, so you need it recorded.
By logging these details in a platform like Dronedesk, you create a single source of truth for the project. It ensures your flight ops are perfectly aligned with the analytical goals and what the client expects. Nailing this initial step guarantees your final deliverable solves a real business problem and clearly shows the ROI of your drone services.
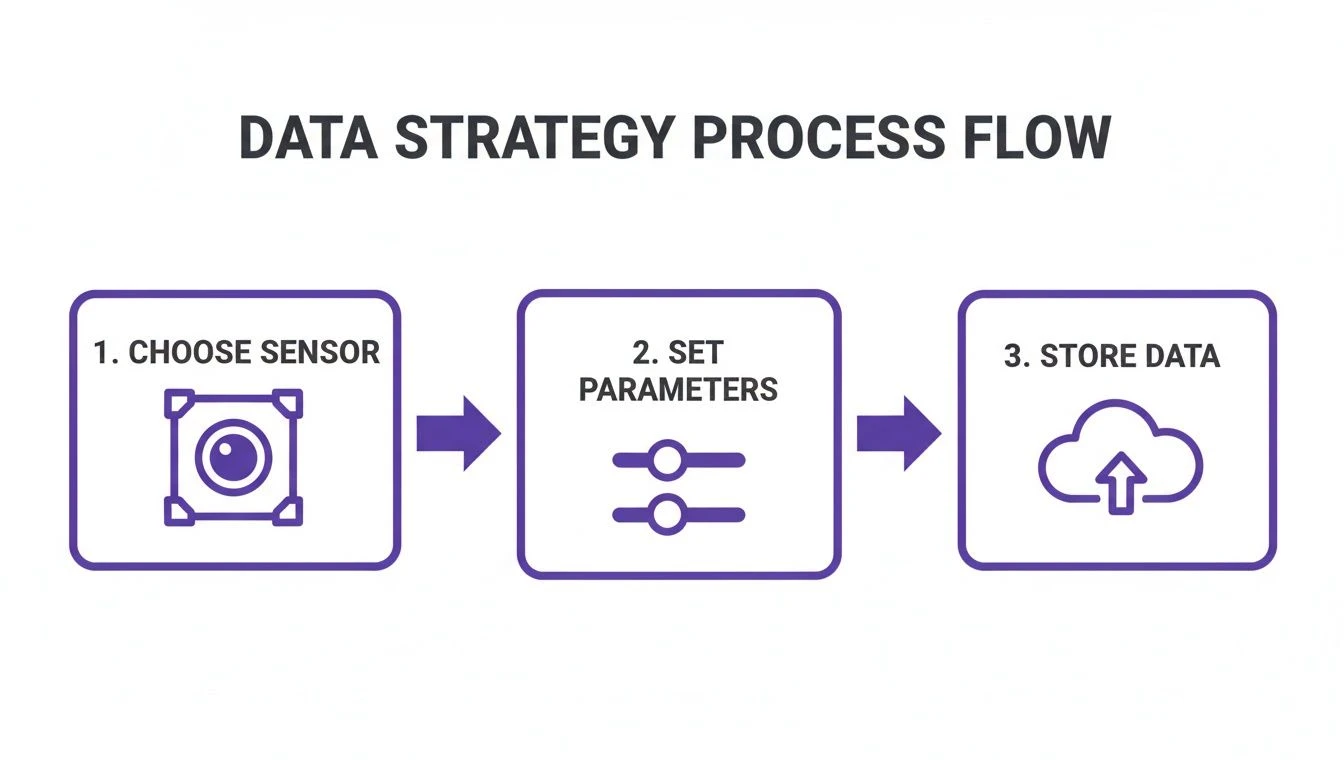
Designing Your Data Capture and Storage Strategy
Garbage in, garbage out. It’s a cliché for a reason, and nowhere is it truer than in drone data analysis. The quality of your final report or model is decided the moment you start planning the flight, not when you open your processing software.
It all starts with picking the right sensor for the job. Your project goals should make this an easy choice. If you’re doing a visual inspection, you’ll want a high-resolution RGB camera. For crop health, it's a multispectral sensor. And for dense 3D models of complex sites, nothing beats LiDAR.
Setting Your Mission Parameters
Once you have the right sensor, you need to nail your flight settings. Every single time. Getting into the habit of standardizing your mission parameters is what separates the pros from the amateurs. It stops those frustrating data issues that only show up hours later during processing.
Here are a few of the non-negotiables I have on my pre-flight checklist:
- Flight Altitude: This sets your Ground Sample Distance (GSD). Flying lower gives you more detail (a lower GSD), but it means more flight time and more data to crunch. It’s always a trade-off.
- Image Overlap: For any kind of mapping, a frontal and sidelap of 70-80% is my go-to. Skimp on this, and you’ll get nasty gaps or warping in your final orthomosaic or 3D model.
- Camera Settings: Lock everything down before you take off. That means focus, shutter speed, and ISO. Auto settings will give you inconsistent exposures that are a nightmare to stitch together.
- Ground Control Points (GCPs): If you need survey-grade accuracy for things like construction monitoring or boundary surveys, GCPs are essential. Don't skip them.
Getting this right in the field is half the battle won. For a deeper look at the nitty-gritty, we've put together a full guide on the best practices for UAV data collection.
I find a simple reference table is a great way to ensure my team is consistent. Here are some solid starting points for common jobs.
Data Capture Standards for Common Drone Missions
| Mission Type | Primary Data | Recommended Overlap | Typical GSD/Point Density | Key Consideration |
|---|---|---|---|---|
| 2D Orthomosaic Mapping | RGB Imagery | 75% Front / 75% Side | 2-5 cm/px | Consistent lighting is crucial. Avoid flying with scattered clouds. |
| 3D Modelling (Structures) | Oblique RGB Imagery | 80% Front / 80% Side | <2 cm/px | Multiple flight altitudes and camera angles (nadir + obliques) are a must. |
| Topographic Survey | LiDAR | 50-60% Sidelap | 50-150 pts/m² | Focus on capturing ground points; plan flights for "leaf-off" seasons if possible. |
| Agricultural Analysis | Multispectral | 70% Front / 70% Side | 5-10 cm/px | Calibrate the sensor with a reflectance panel before and after the flight. |
| Façade Inspection | RGB Imagery / Video | N/A (Manual Flight) | <1 cm/px | Maintain a consistent distance from the building face for comparable imagery. |
Of course, you'll need to tweak these based on your specific client needs and site conditions, but they serve as a reliable baseline.
Mastering Data Organization and Storage
So you’ve landed, and the capture went perfectly. Now comes the next headache: managing the mountain of data you just created. A single project can easily spit out terabytes of raw images, processed files, and deliverables. Without a system, you’ll be lost in a digital mess.
The first thing you need is a rigid file naming convention. Settle on one and stick to it. A simple ClientName_ProjectID_Date_DataType structure (like Smiths-Construction_P102_2024-10-26_Raw-Images) makes life easier for everyone. No more guessing what IMG_8472.jpg belongs to.
Then, you have to decide where it all lives:
- Local Storage: Super-fast access, which is great for processing. But it’s on you to manage the hardware, backups, and security.
- Cloud Storage: You can access it from anywhere, and it’s easy to scale up. The trade-off is slower transfer speeds and those recurring subscription fees.
- Hybrid Approach: This is what most of us end up doing. Use fast local storage (like a NAS) for active projects and push completed jobs to the cloud for long-term archiving.
It's an interesting side note that the drone market is dominated by Asian manufacturers, which account for 70-80% of commercial drone production. With so many of us flying DJI drones, having a way to sync data automatically from their flight apps is a massive time-saver. You can read more about the global drone market dynamics on futuremarketsinc.com.
This is exactly the kind of chaos platforms like Dronedesk are built to fix. The moment you land, files are automatically linked to the right job, client, and location. It brings order to the data management process right from the source, saving you from the soul-destroying admin of manually sorting and labelling hundreds of files.
Nailing Your Data Processing and QA Workflow
Raw drone data is just that—raw. It's a pile of digital puzzle pieces. The real value comes when you put that puzzle together through processing. Without a solid workflow, you're just gambling with the classic "garbage in, garbage out" problem, and nobody wants their analysis built on a shaky foundation. This is where you turn thousands of individual photos or a messy point cloud into a single, reliable asset you can actually measure and work with.
The first part of this process is all about preprocessing. This is where the photogrammetry software does its heavy lifting—georeferencing the data, stitching all those images into one big, seamless orthomosaic, and building out a 3D model or point cloud. For some jobs, you might also need to classify point clouds to tell the difference between the ground, trees, and buildings.
Think of it as a straightforward, repeatable process that starts way before you even get back to the office.
As you can see, the whole thing kicks off with choosing the right sensor for the job, dialing in your capture settings on-site, and having a smart storage plan. These steps are the bedrock for everything that follows.
Your Must-Have Quality Assurance Checklist
Once the initial processing churns out a result, you’ve hit the most important checkpoint in the entire workflow: Quality Assurance (QA). I’ve seen too many operators skip this, only to end up with inaccurate reports and frustrated clients. Your QA check doesn't have to be some monumental task, but it absolutely has to be consistent.
The best way to do this is with a simple checklist. Get one written up that your whole team can follow for every single project. It keeps everyone on the same page, looking for the same potential problems before that data gets anywhere near the final analysis.
Here’s what I’d put on any solid QA checklist:
- Image Quality: Hunt for any serious motion blur or fuzzy areas. These are dead giveaways for artifacts and wonky models later on.
- Seamline Errors: Zoom into your orthomosaic and look for visible lines or weird misalignments where the images were stitched. These can completely wreck your measurements.
- GCP Alignment: If you used Ground Control Points, go straight to the alignment report. A high Root Mean Square Error (RMSE) is a big red flag that your accuracy is off.
- Model Integrity: Give your 3D models a thorough look-over. You’re searching for warping, holes, or those "melty" looking surfaces, which often pop up on building edges or other complex shapes.
- Point Cloud Noise: Scan your point cloud for stray points floating above or below the main surface. This "noise" has to be filtered out before you can trust the data.
A tough QA process is non-negotiable. It’s the firewall protecting you from small capture mistakes that can balloon into huge inaccuracies in your client deliverables. This is how you build trust in your work.
Following a structured process like this ensures that the hours you pour into analysis are never wasted on bad data. To dig deeper into creating a truly connected data environment, check out our guide on data integration best practices.
If you want to see how these principles come together in the real world, it’s worth looking at how specialized services put their data to work. For a great example of a polished workflow in action, you can see how their data analysis system works.
Choosing Your Analysis Tools and Defining Team Roles
A solid data analysis plan hinges on two things: the right software and the right people. Once you've nailed down your objectives and figured out your data capture strategy, it's time to build your tech stack and decide who's responsible for what. This is where you connect the dots from data capture in the field to the final product on your client's desk.
Picking your analysis tools can feel like a minefield, but it really just comes down to matching the software's strengths to your project's KPIs. For instance, if your bread and butter is creating orthomosaics for construction site progress, photogrammetry software like Pix4D or Agisoft Metashape is going to be your workhorse. If you're all about agricultural analytics, you'll need a platform that’s a pro at creating and making sense of vegetation index maps like NDVI.
Building Your Integrated Tech Ecosystem
Here’s a tip: don’t just think about individual tools. Think about creating an integrated ecosystem. You need software that plays nicely together to cut out mind-numbing manual data entry and avoid disjointed, clunky workflows. This is where an operations management platform becomes the central nervous system of your whole analysis plan.
Take a platform like Dronedesk, for example. It does more than just manage your flights; it acts as the glue holding everything together. By automatically syncing flight logs and operational data from DJI, it ensures every dataset is instantly tied to a specific job, client, and the objectives you set out earlier. That kind of seamless connection is a game-changer for efficiency and keeping a clean audit trail.
The industry is catching on, too. The drone communication market, which covers all the infrastructure for data transfer, was valued at $2,839.7 million in 2025 and is set to more than double. You can dig deeper into the expanding drone communication market on fortunebusinessinsights.com. This boom shows just how vital reliable data pipelines are becoming.
Clarifying Roles and Responsibilities
Even if you’re a one-person show, mentally putting on different "hats" for each role is brilliant for staying organized. For larger teams, defining who owns each part of the process is non-negotiable if you want to prevent bottlenecks and make sure someone is accountable. A clear structure kills confusion and guarantees smooth handoffs between each stage.
Here’s a simple breakdown of roles you can adapt, whether you’re a solo operator juggling everything or a manager leading a team:
-
Data Capture Specialist (The Pilot): Their job is to fly the mission exactly as planned, sticking to the capture standards you've defined. They are responsible for delivering high-quality, analysis-ready raw data. Nothing more, nothing less.
-
Data Processing Technician (The Processor): This person takes the raw data from the pilot and feeds it into your chosen photogrammetry or analytics software. They also handle the first-pass QA check against your quality checklist.
-
Data Analyst (The Interpreter): This is the person who digs into the processed data to pull out the actual insights. They're the ones doing the measurements, spotting anomalies, and preparing the findings that answer your client’s original question.
-
Project Manager (The Communicator): They have a bird's-eye view of the entire workflow, handle all client communication, and are ultimately on the hook for delivering the final report or product.
Even as a solo pilot, thinking in these distinct roles helps you structure your time. You'll consciously switch from "pilot mode" during capture to "analyst mode" during interpretation, bringing more focus to each step of your data analysis plan.
Creating Client Deliverables That Showcase Value
This is where the rubber really meets the road. All your careful planning, flying, and processing culminates in one thing: showing the client undeniable value. Simply exporting a raw point cloud or a massive GeoTIFF and emailing it over isn't a deliverable. Honestly, it’s just an unfinished job.

Real value is born when you turn that complex data into a compelling story—one with insights that directly answer the client’s original business questions. You have to make the data make sense to them.
Beyond the Export Button
It's time to think beyond basic file exports. The goal is to create deliverables that are interactive and immediately useful for your client, who, let's face it, probably isn't a photogrammetry expert.
Here are a few high-impact deliverables that consistently impress clients:
- Annotated Inspection Maps: Don't just send a high-res orthomosaic. Give them a map with specific issues—like roof defects or areas of crop stress—clearly marked up with notes, measurements, and severity ratings.
- Shareable 3D Models: Provide a simple web link to a 3D model where clients can fly through the site themselves. The best platforms have built-in tools allowing them to take their own measurements for volume, distance, or area without needing any special software.
- Concise Summary Dashboards: For recurring projects, a one-page dashboard showing KPI trends is incredibly powerful. It summarizes progress and flags changes at a glance, saving the client from digging through pages of reports.
The trick is to match the deliverable to the job's original objective. For a deeper dive on turning your data into reports that clients actually read, check out our post on business intelligence reporting.
The Power of Professional Templates
One of the smartest things you can do for your business is to create reusable templates for your reports and checklists. This is the absolute cornerstone of a scalable analysis plan.
Having a standardized report template does more than just save time. It builds a consistent, professional brand image that clients come to recognize and trust. Every report that leaves your office should look like it came from the same expert source.
Your template should include standard sections like a project overview, summary of findings, key visuals, and detailed annotations. This not only makes future projects more efficient but also acts as a quality check, ensuring you never forget to include crucial information.
By pulling in operational data from a platform like Dronedesk, you can give your client the complete picture. Including details like flight dates, pilot information, and on-site weather conditions alongside your analysis provides a transparent, professional account of the entire operation. This level of detail is what separates the amateurs from the pros and turns one-off jobs into long-term client relationships.
Frequently Asked Questions
When you're first getting your head around building a data analysis plan, a few common questions always seem to pop up. I've heard these from countless pilots over the years, so let's tackle them head-on.
I’m Just a Solo Operator. How Do I Even Start This?
It's easy to get overwhelmed. The key is to start small. Don't try to build a data plan for ten different services at once. Just pick one.
Let's say you want to offer basic roof measurement reports. Your goal is to absolutely nail that one deliverable. Document every single thing you do, from your drone's flight and camera settings to how you actually build the final PDF for the client. A simple checklist will do the job perfectly.
That checklist? That's your first data analysis plan. It’s repeatable. Once you've got it down and you're turning out consistent results, you can start refining it, maybe adding thermal inspections or other services to your repertoire.
What's the Biggest Mistake People Make?
Hands down, the most common (and costly) mistake is blowing right past the quality assurance (QA) step. I get it. You're excited to see that slick 3D model or the finished orthomosaic. But skipping a proper check of the processed data itself is a huge gamble.
Rushing past QA is a recipe for disaster. It leads directly to inaccurate measurements, flawed analysis, and deliverables that ultimately erode client trust and can seriously damage your reputation.
Seriously, taking just 15 minutes to run through a quick QA checklist before you dive into the final analysis can save you hours of painful rework and protects the integrity of your results.
Do I Really Need to Shell Out for Expensive Software?
Not at all, especially when you're just getting your feet wet. While the big-name desktop software packages are incredibly powerful, they come with a hefty price tag. Thankfully, many cloud-based platforms now offer much more accessible pay-per-project or affordable monthly plans.
The most important thing is to pick a tool that reliably produces the specific deliverable you've promised the client, and that fits comfortably within your project budget. Focus on mastering one tool that gets the job done right before you start building out a more complex software stack.
Simplify your entire drone operation—from flight planning to client reporting—with Dronedesk. Our platform helps thousands of pilots save time and stay compliant, ensuring every project is built on a solid foundation. Start your free trial today at Dronedesk.io.
 Beyond Visual Line of Sight Explained for Operators →
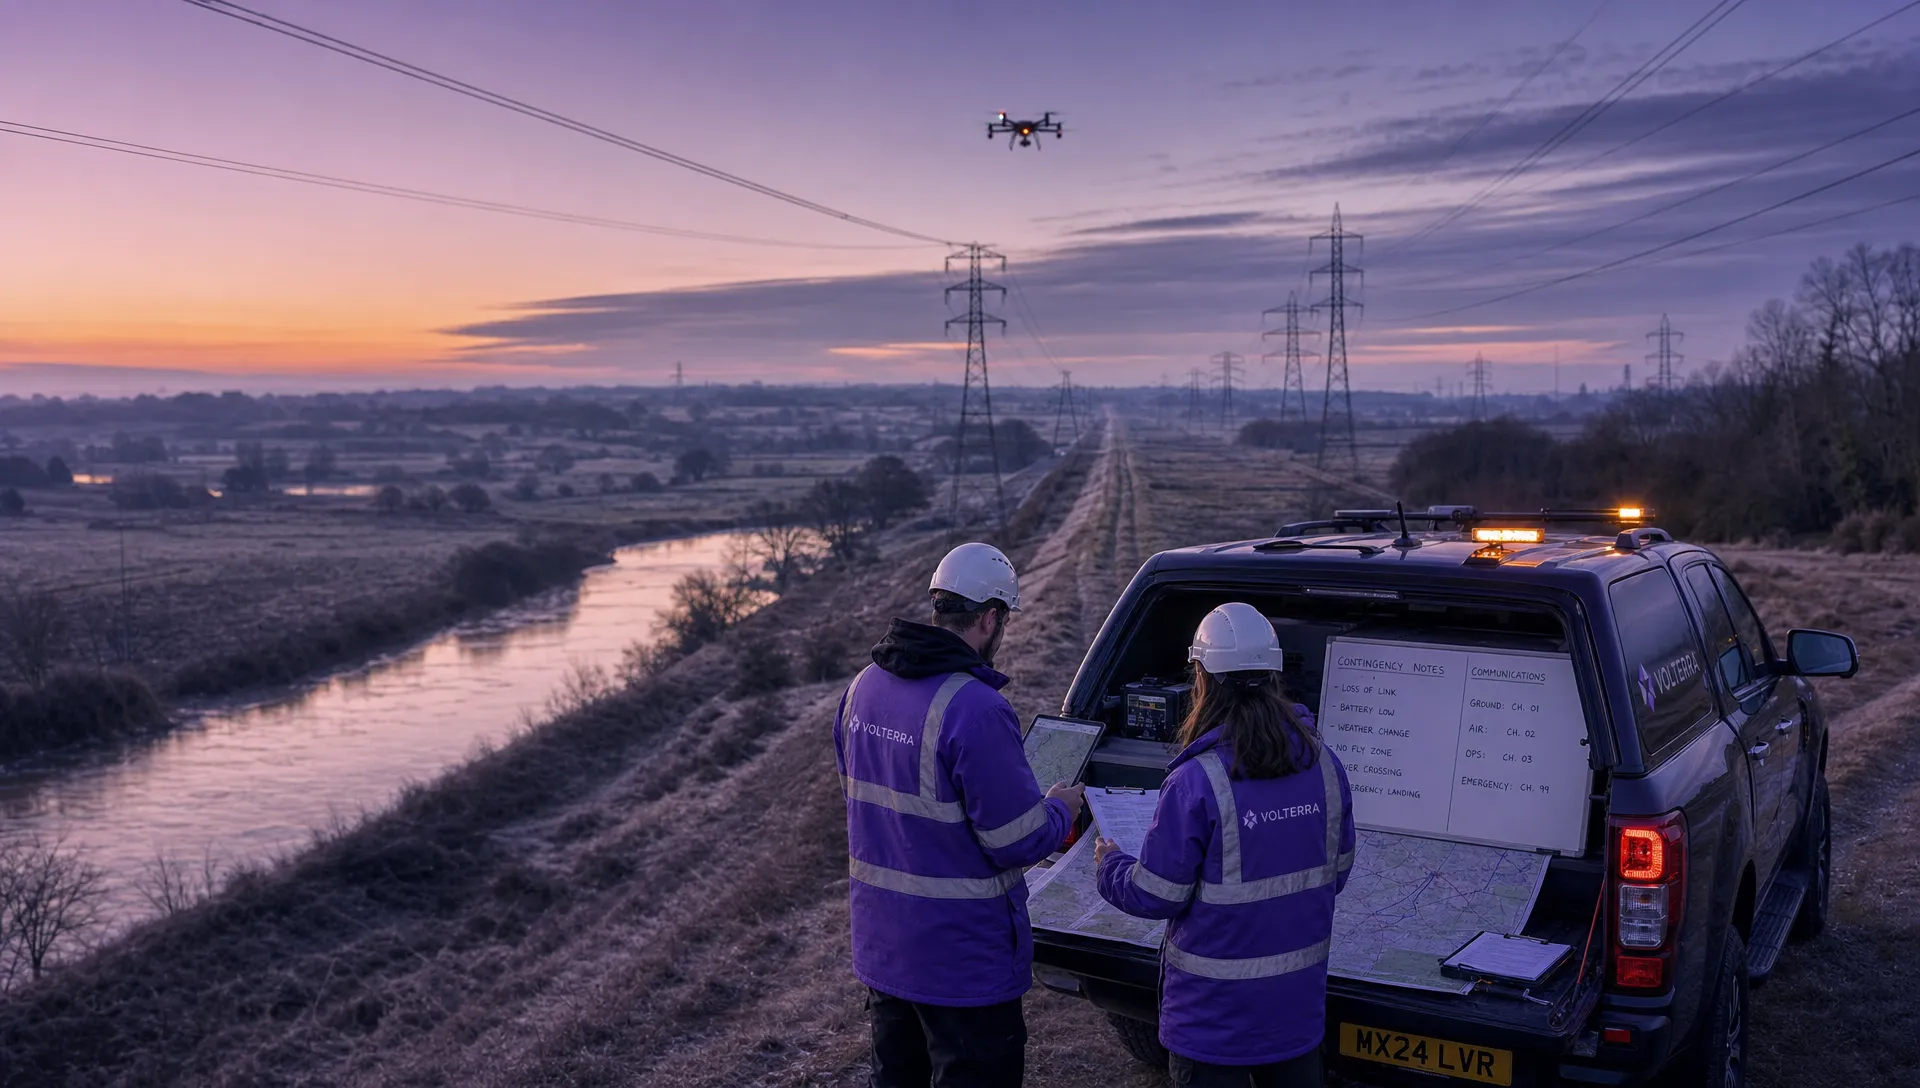 How BVLOS Drone Operations Change Commercial Workflows →
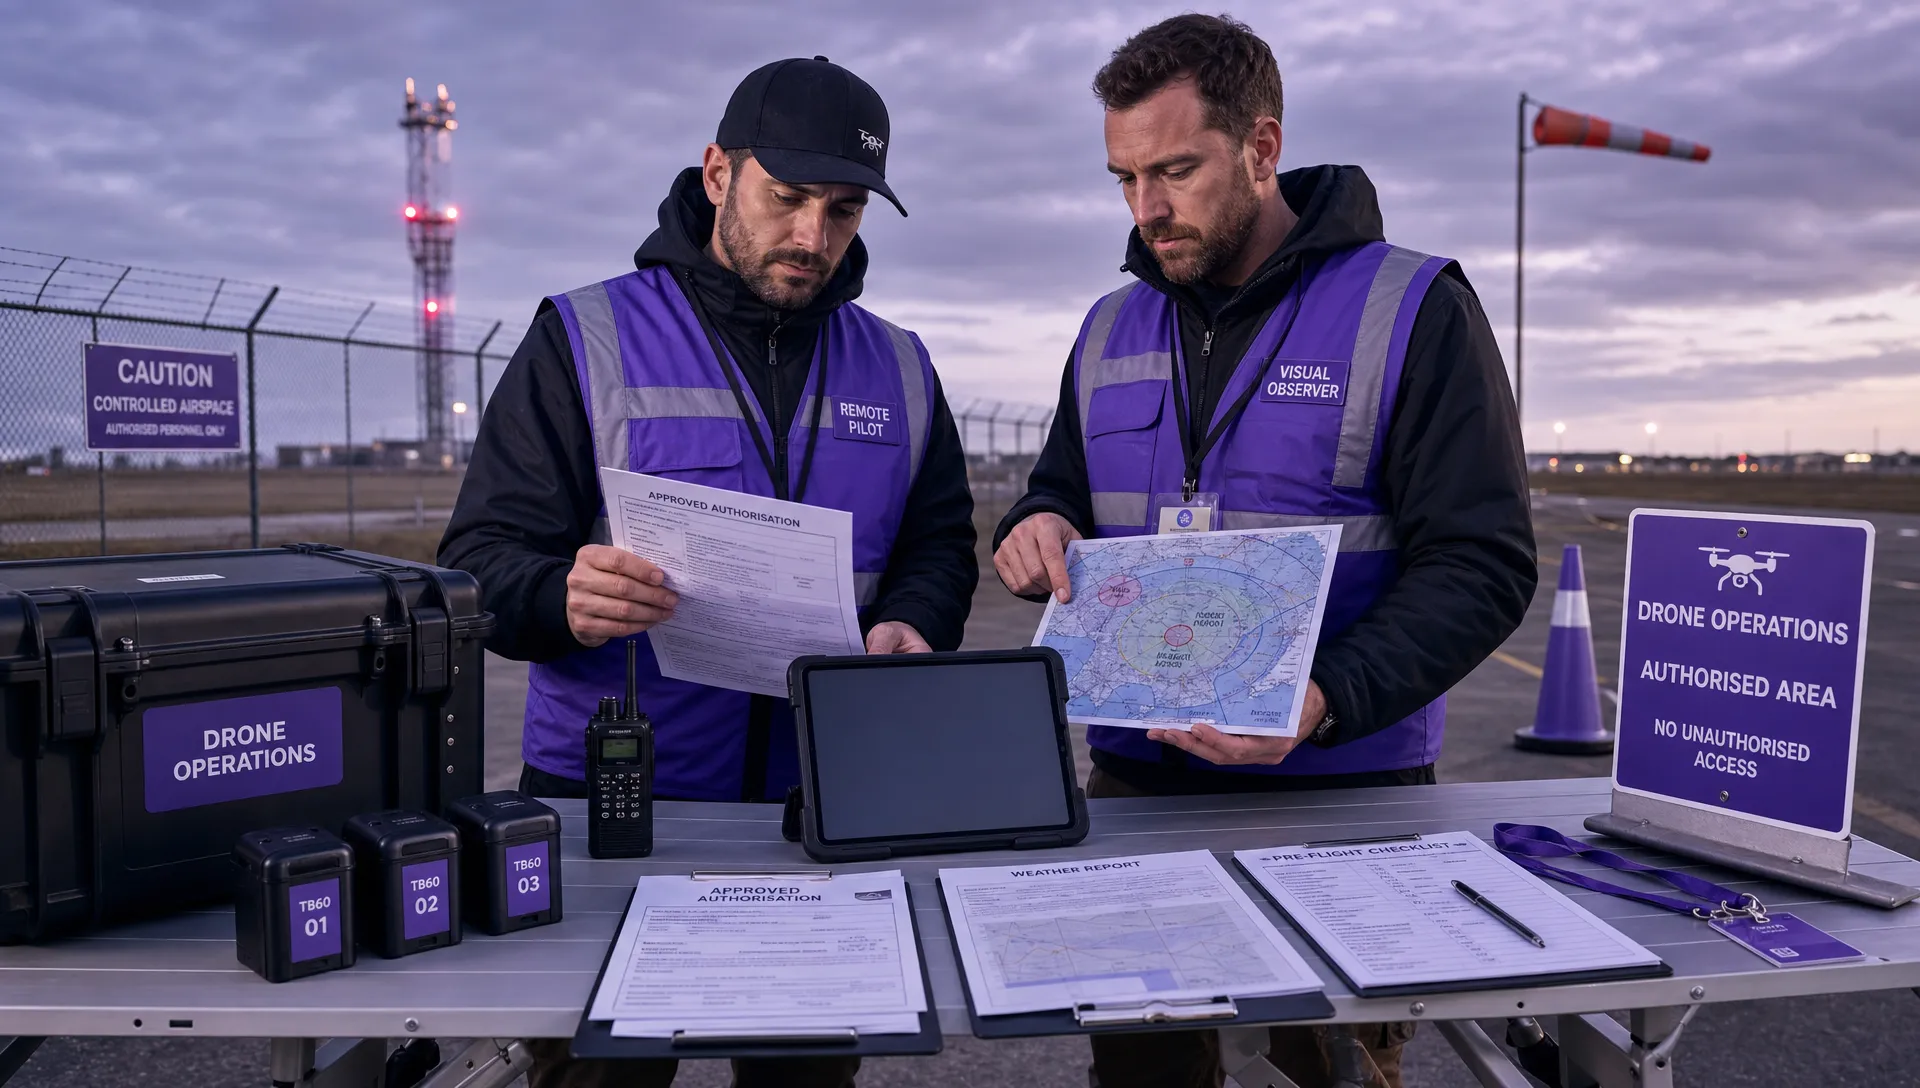 FAA Drone Rules Every Commercial Pilot Should Know →
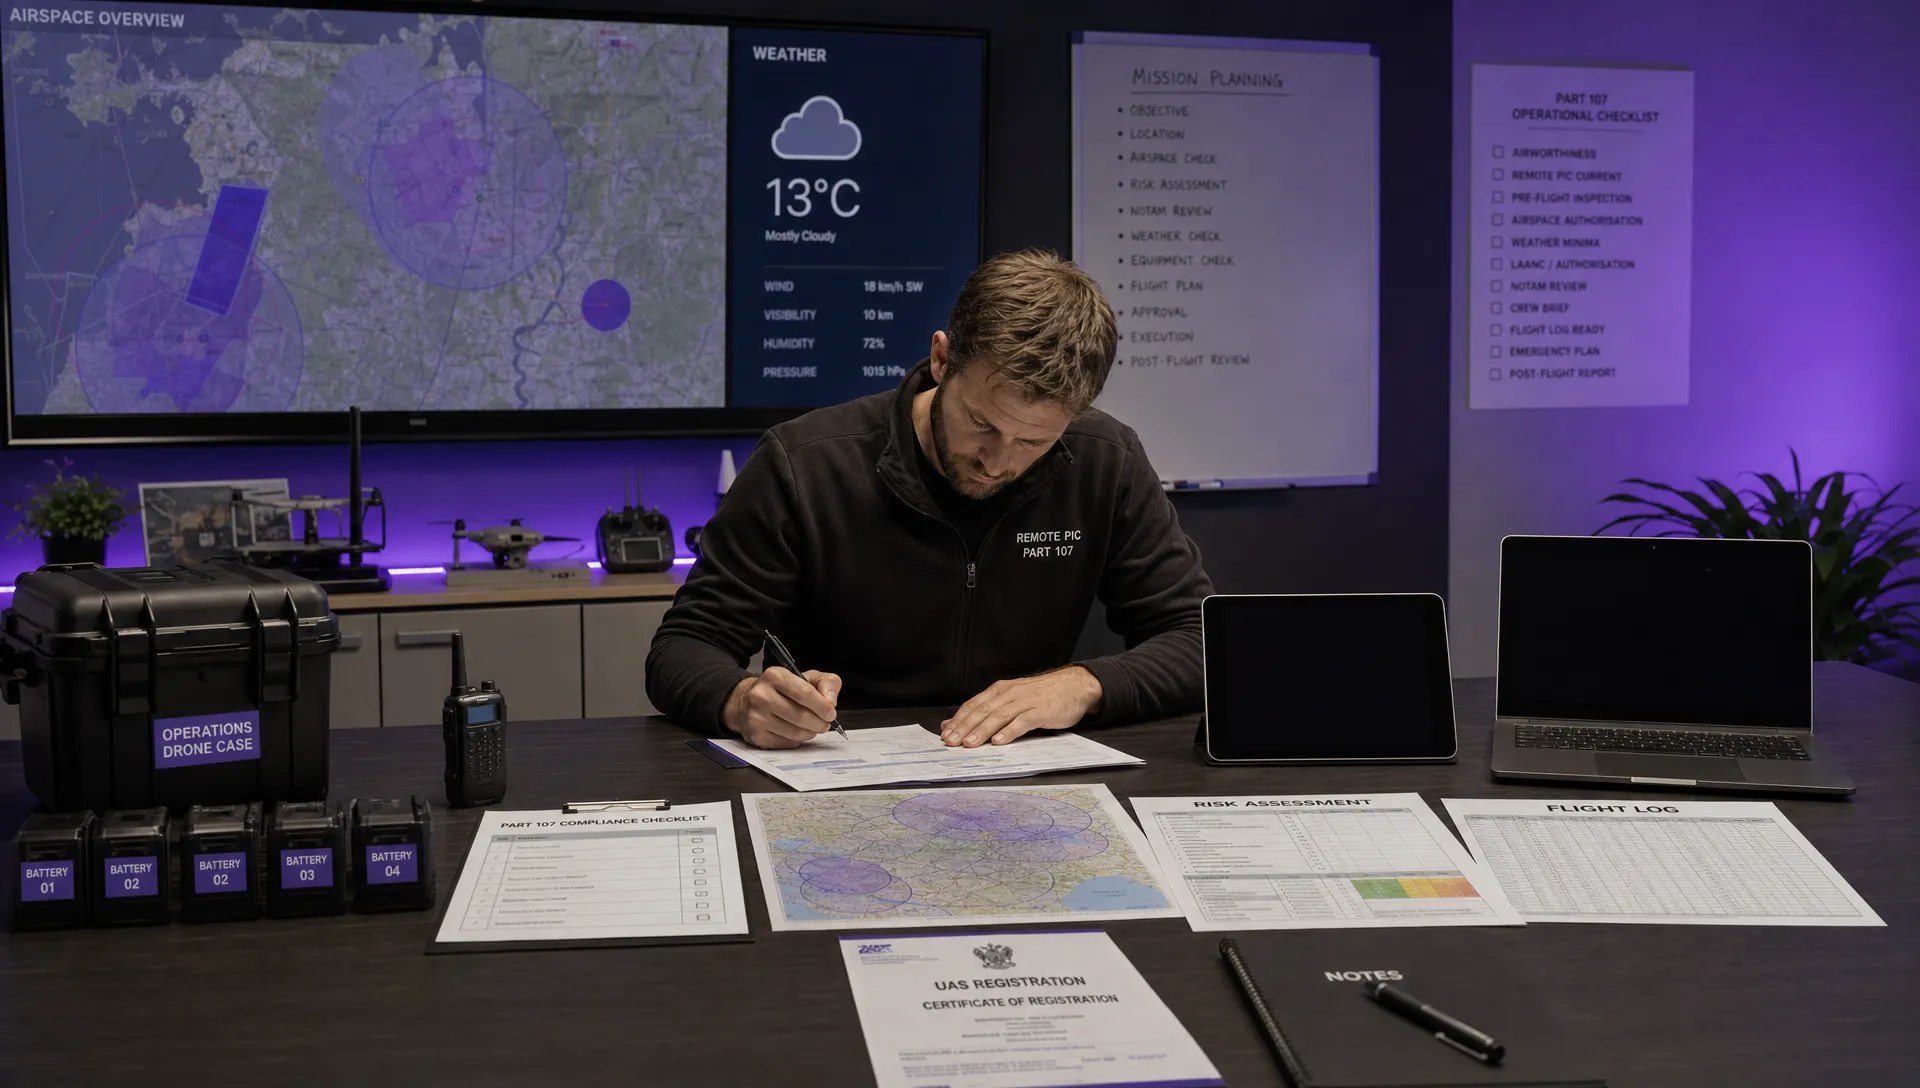 FAA 107 Explained for Commercial Drone Operators →
 Canadian Drone Regulations Explained for Business Use →
 FAA Part 107 Drone License Explained for Beginners →
 How to Review a DJI Drone Flight Log Step by Step →
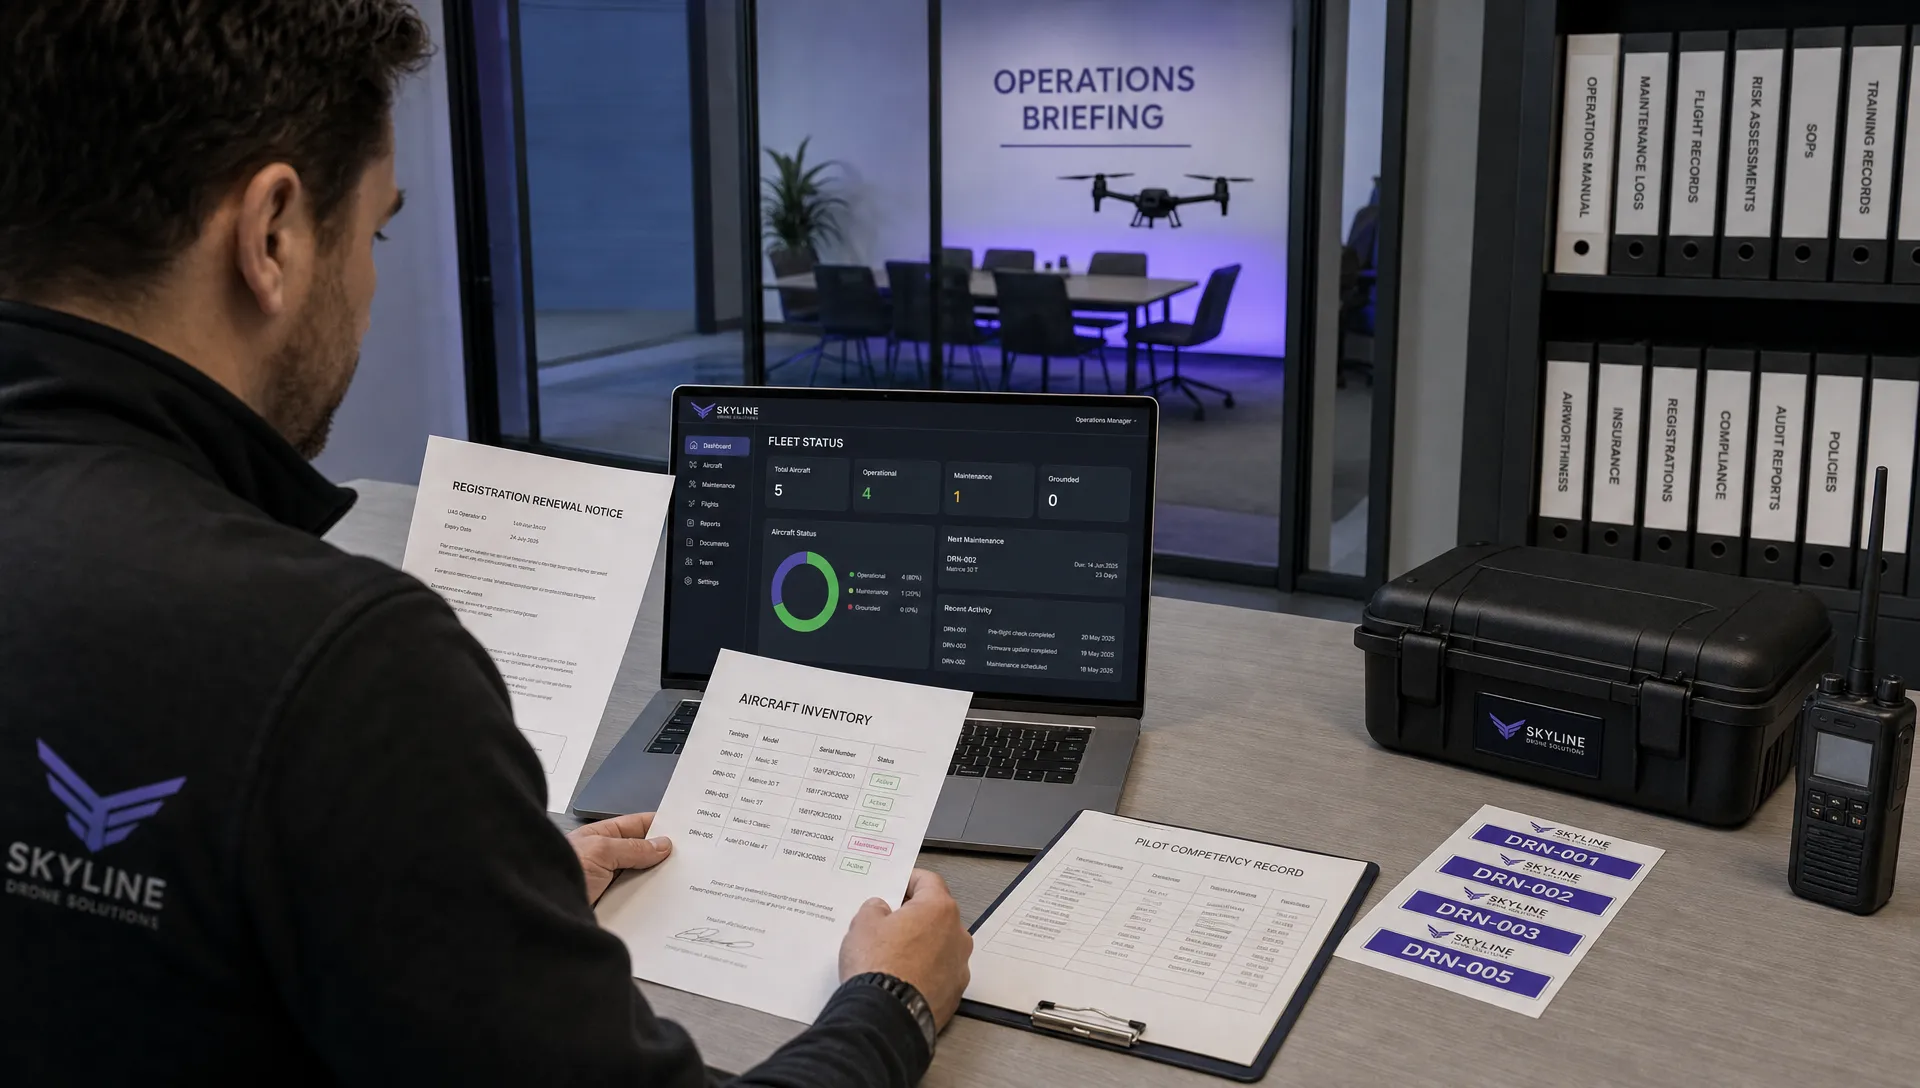 Drone Registration Law Explained for Commercial Pilots →
 How to Check a Drone NOTAM Before Every Mission →
 BVLOS Drone Meaning and Why It Matters →