From Hours to Minutes: The New Dronedesk Site Plan for SORA Flight Planning
If you've ever spent a full afternoon manually pulling population density figures, calculating buffer zones in a spreadsheet, and stitching together a SORA submission document, you already know the problem. SORA flight planning is thorough by design. But the manual process of getting there has been a bottleneck that holds back operators from taking on more complex, more profitable work.
We've completely rebuilt the Dronedesk site plan to fix that. Not a facelift. Not a few new buttons. A ground-up rebuild of how you plan, assess, and document SORA-compliant drone operations, including BVLOS. What used to take hours (sometimes a full day for complex linear operations) now takes minutes.
Here's what changed, and why it matters for your operations.
A Complete Rebuild, Not an Update
The old approach to SORA planning looked something like this: draw your flight area in one tool, switch to a separate dataset to estimate population density, open a spreadsheet to calculate buffer zones, cross-reference tables for ground and air risk, then manually compile everything into a document that might or might not satisfy the regulator on first review.
Every step introduced room for error. Every step ate time.
The new site plan brings all of that into a single, integrated workflow. Three things make this possible:
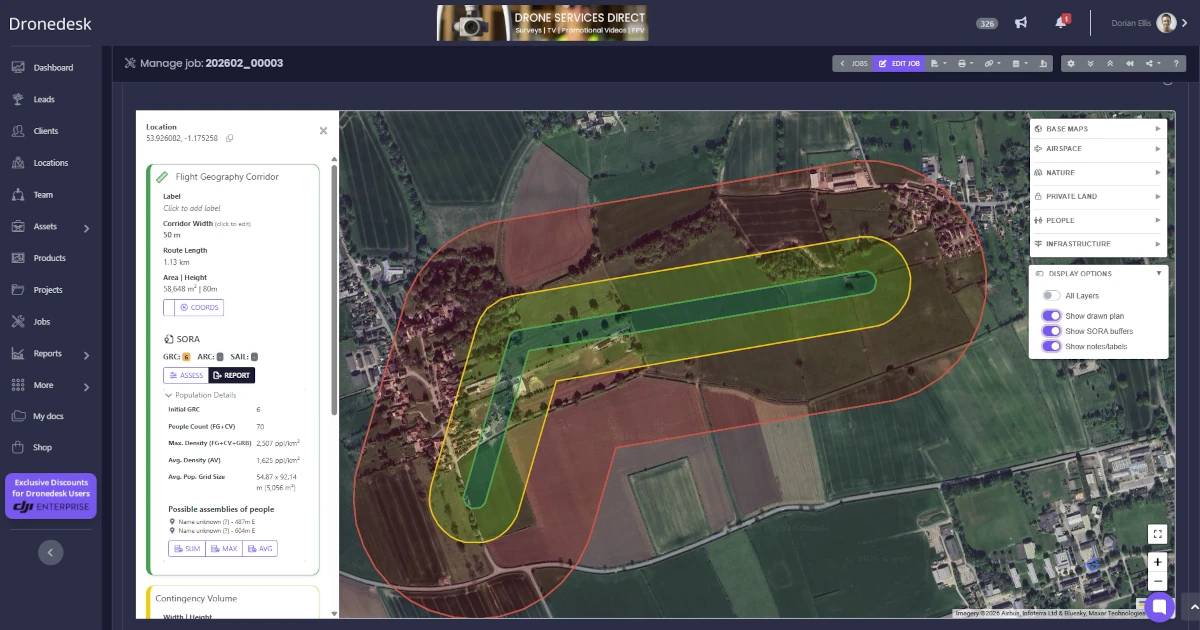
Integrated global population data. We've built the Copernicus Global Human Settlement Layer (GHSL) directly into the platform. This is real demographic data at sub-100 metre grid resolution, worldwide. When you draw a flight area, the system queries this dataset automatically and calculates population figures across your operational zones. No more eyeballing density maps or making rough estimates.
Automated buffer and risk calculations. Draw a shape, and the system generates your buffer zones, calculates population statistics for each zone, and classifies your ground risk. Apply mitigations with a click and watch the SAIL level update in real time. The maths happens behind the scenes using geodesic algorithms that properly account for Earth's curvature, so the numbers are accurate, not approximations.
One-click report generation. When you're done, generate a complete SORA assessment report ready for regulatory submission. One click. The report includes your embedded map, KML geometry, all population statistics, applied mitigations, risk classifications, and your final SAIL determination. Print it, export it as PDF, submit it.
The Features That Save You Real Time
Plenty of tools can show you a map. The difference here is in the specifics of how the new site plan handles the workflows that actually slow operators down.
Corridor Tool and Corridor Splitting
If you do linear infrastructure work (pipelines, power lines, rail corridors, road surveys), you know the pain of planning a long BVLOS route. Manually plotting a consistent-width corridor along a winding path is tedious and error-prone.
The new corridor tool lets you click waypoints along your intended route, specify a width, and the system generates a properly buffered flight geography automatically. No more calculating polygon vertices by hand or struggling to keep widths consistent around bends.
Better still, you can split long corridors into segments with a single click. Specify your desired segment length, and the system divides the route into discrete operational phases, each with its own buffers and population calculations. For a 20km power line inspection, you might split into 2km segments, each one independently assessed and ready to fly.

Reverse Planning
Sometimes you know where your Ground Risk Buffer needs to end, not where your flight geography should start. Maybe there's a housing estate on one side and a motorway on the other, and your GRB can't extend past either.
The reverse planning tool lets you draw your outer boundary first, then click convert. The system calculates the resulting flight geography by shrinking inward by the CV and GRB distances. What used to be a trial-and-error loop of draw, check, adjust, repeat now takes one click.
Building Boundary Tool
For building inspections, rooftop surveys, or any operation where your flight area needs to conform to a specific structure, the map now displays 2.5D building footprints from OpenStreetMap. Click on a building, specify a buffer distance in metres, and the system generates a flight geography that wraps around the structure.
This is one of those features that sounds simple but saves a surprising amount of time. Anyone who's tried to manually draw a polygon that hugs an L-shaped building with a 15-metre buffer will appreciate it.
Population Analysis You Can Actually Audit
Click any flight geography and you get a full breakdown of population statistics across all buffer zones: maximum density (for ground risk classification), average density (for extended risk consideration), and total population counts. Every figure can be exported to a spreadsheet showing the per-cell breakdown.
That last part matters. Regulators want to see your working, not just your conclusions. Having cell-level population data available for audit means your submission is backed by verifiable evidence, not estimates or assumptions. It also means fewer questions from the CAA and a faster path to approval.

One-Click SORA Reports
The SORA report generator pulls together everything from your site plan into a single, structured document: map, geometry, population data, ground risk assessment, air risk assessment, applied mitigations, and final SAIL determination.
The compliance prompts built into the assessment interface deserve a mention here too. When you apply a mitigation, the platform prompts you to provide supporting evidence. This catches gaps before your submission reaches the regulator, rather than after. If you've ever had an application bounced because you forgot to evidence a particular mitigation, you'll understand why this matters.
Plan Locking
Once you've created your plan and completed your SORA assessment, you can lock the plan down to prevent anyone else from changing it. Once a plan is locked, only you, or your system admin, can unlock it so you can be sure no meddling hands can mess up your hard work.
What's Under the Hood
You don't need to care about the engineering to benefit from it, but for the technically curious: population calculations run in parallel using Web Workers, so the interface never freezes while the system is crunching numbers. Buffer zones use geodesic algorithms with sub-metre accuracy. Overlay data loads from an intelligent caching layer, so repeated queries are near-instant, and background preloading often has the data ready before you ask for it.
The short version: it's fast, and it stays fast even when you're working with large, complex operational areas.
Plays Well With Your Other Tools
The site plan doesn't exist in isolation. Most operators work within a broader ecosystem of GIS tools, UTM providers, and airspace management systems.
KML exports are available in multiple configurations: flight geometries only (for sharing operational areas), full SORA packages including buffers and pilot positions, or complete plans with all markers and annotations. Everything opens correctly in Google Earth, QGIS, and other standard GIS software.
GeoJSON export is there for integration with UTM providers and airspace authorisation systems. The export handles the conversion of circles to polygons (since GeoJSON doesn't support native circles) and ensures correct coordinate winding order for maximum compatibility.
Flight areas can also be labelled with custom text that displays directly on the map and carries through to all exports and reports. Useful for annotating pilot positions, naming discrete flight areas within a larger operation, or adding notes that need to travel with the geometry.
What This Means for Your Operations
The maths here is straightforward. If a complex SORA submission used to take you a day of preparation, and it now takes an hour, that's time you can spend flying, winning new work, or going home at a reasonable hour.
More importantly, the accuracy and audit transparency of the population data means stronger submissions. Fewer rejections. Faster approvals. And for operators who've been avoiding BVLOS work because the planning overhead was too daunting, the barrier just dropped significantly.
If you're already running your operations through Dronedesk, log in and try the new site plan. The corridor tool alone is worth a look if you do any kind of linear work. If you haven't used Dronedesk before, start a free trial and see how it handles your most complex operation. You might be surprised how quickly you get from a blank map to a submission-ready SORA report.

 FAA Remote ID Rule Explained for Commercial Pilots →
 Drone Legal Requirements for Commercial Operations →
 Drone Near Airport Rules Explained for Safer Planning →
 International Drone Regulations Every Global Team Should Know →
 Drone Flight Risk Assessment Example for Safer Missions →
 Beyond Visual Line of Sight Explained for Operators →
 How BVLOS Drone Operations Change Commercial Workflows →
 FAA Drone Rules Every Commercial Pilot Should Know →
 FAA 107 Explained for Commercial Drone Operators →
 Canadian Drone Regulations Explained for Business Use →