Drone Operational Efficiency Metrics
Operational efficiency metrics are the numbers that tell you how well you’re turning resources—time, money, equipment, people—into successful flights. They’re the hard proof of performance that lets you stop guessing and start making data-driven decisions. Getting a handle on these metrics is non-negotiable if you want to control costs, fly safer, and scale your operations without going broke.
Why Your Drone Program Needs Operational Efficiency Metrics
Picture two professional drone outfits. Program A is constantly fighting budget fires, dealing with drones grounded for surprise maintenance, and apologising to clients for missed deadlines. Program B, on the other hand, runs like a well-oiled machine, growing its fleet profitably and keeping clients happy with data delivered on schedule.
The difference isn't luck. It's a commitment to tracking the right data.
This guide is all about the operational efficiency metrics that separate the thriving programs from the ones that are just getting by. We're going to get past the buzzwordy idea of "doing more with less." For us, it means hitting the highest levels of safety, value, and reliability with the resources you have. It's about building a system where every flight, every drone, and every team member is pulling their weight and adding to your bottom line.
From Vague Goals to Tangible Numbers
Without metrics, saying you want to "improve" is just wishful thinking. With them, it’s a strategy. Tracking the right data gives you the critical insights you need to dial in every part of your operation, from pilot performance to the health of your aircraft. For instance, instead of just feeling like a particular drone is expensive to run, you can nail down its exact cost per flight hour.
This data-first approach lets you:
- Justify Investments: Prove the ROI on a new sensor or a piece of software with solid numbers.
- Find the Weak Spots: See exactly where the bottlenecks are in your workflow, whether it's on-site or back in the office processing data.
- Fly Safer: Use leading indicators to spot risks and prevent incidents before they ever have a chance to happen.
- Boost Your Profits: Make smart decisions that cut down on waste and open up more capacity for revenue-generating missions.
The real goal here is to turn your operational data from a simple log of what happened into a predictive tool that tells you what to do next. That's the heart of building a resilient, scalable drone program.
At the end of the day, tracking these numbers gives you a clear, unbiased look at the health of your program. It helps you answer the big questions like, "Are we really as efficient as we think we are?" and "Where's our single biggest opportunity to get better?" Building on that foundation is the only way to achieve sustainable growth and stay ahead in this industry.
Tracking Your Core Drone Fleet Performance
If you want to move from vague goals like "better performance" to a truly data-driven drone program, you have to start with the numbers. It's all about tracking the essential operational efficiency metrics that tell you the real story of your fleet's health. These aren't just numbers on a spreadsheet; they explain why things are happening and guide your next move.
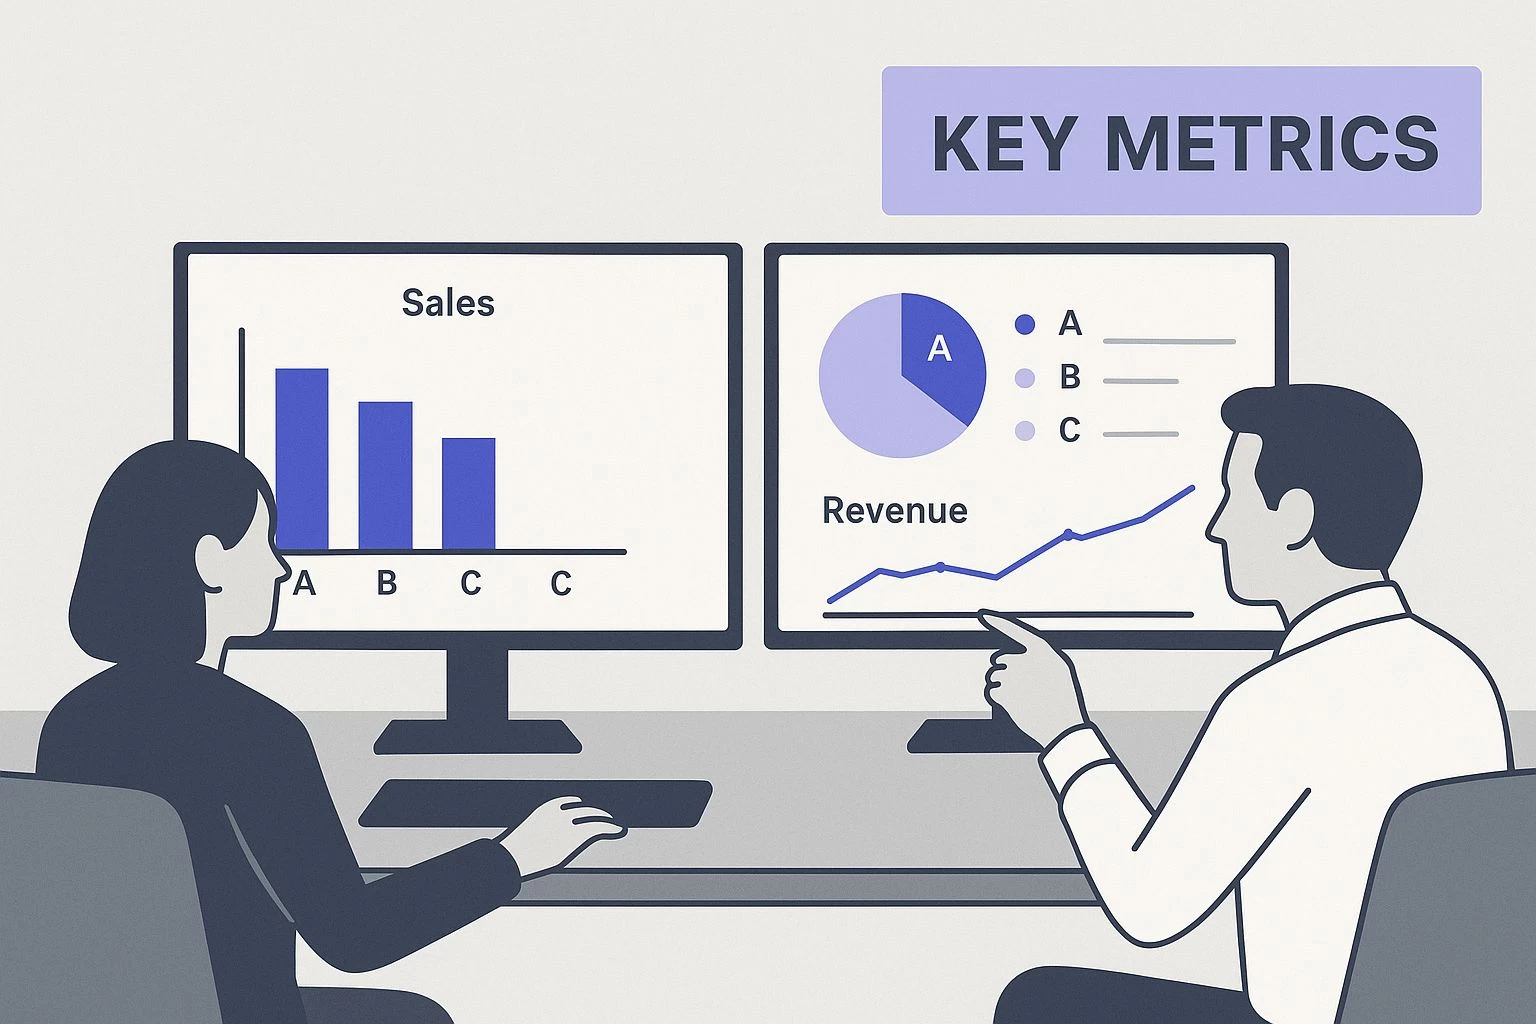
Visualizing this data, as analysts do on monitors, is key. It allows your team to spot performance trends in a heartbeat and make decisions based on solid evidence, not guesswork.
Flight Hours Per Drone and Pilot
Think of flight hours as the heartbeat of your operation. It’s a simple metric with a profound impact.
By tracking Flight Hours per Drone, you can quickly see which assets are your workhorses. Is one drone in the air all day while another sits on the shelf collecting dust? This could be a sign you need to rebalance the workload, or it might tell you that a particular model is perfectly suited for the jobs you're doing.
In the same way, Flight Hours per Pilot shines a light on your most active team members. High hours can point to a top performer, sure. But consistently sky-high hours? That could be a red flag for burnout. On the flip side, low hours might mean a pilot needs more training or simply more opportunities to get in the air.
At its core, this metric is all about how well you're using your resources. It helps you answer one critical question: Are we getting the most out of our most expensive assets—our aircraft and our people?
Good drone fleet management software is a game-changer here, logging these hours automatically and freeing your pilots from tedious admin work.
Cost Per Flight Hour
Knowing your Cost per Flight Hour is like knowing the price of every item on a restaurant menu before you order. It's the ultimate measure of financial efficiency for every single mission. This number goes way beyond the sticker price of the drone itself and reveals the true, ongoing cost to keep it flying.
To get an accurate figure, you need to add up all the related expenses:
- Direct Costs: Things like maintenance, repairs, and battery replacements.
- Indirect Costs: Don't forget insurance premiums and software subscriptions.
- Personnel Costs: This includes pilot salaries and any training expenses.
Divide the total cost by the total flight hours over a set period, and you’ve got a crystal-clear financial benchmark. If one drone model has a high cost per hour, you might reconsider its role in your fleet. A low cost, however, signals a reliable, profitable workhorse. For proving ROI, this is one of the most critical operational efficiency metrics you can track.
Mission Success Rate
Finally, your Mission Success Rate is a powerful indicator of your program's overall reliability and quality. This metric is all about defining what a "win" looks like—maybe it's flawless data capture on the first try, with zero safety incidents or technical glitches.
Calculating it is refreshingly simple: just divide the number of successful missions by the total number of missions you attempted.
If your rate dips below 95%, it might be pointing to deeper issues with your equipment, pilot training, or even your pre-flight planning process. By tracking this metric over time, you can spot negative trends long before they start to affect your client relationships or your bottom line.
Key Drone Fleet Performance Metrics at a Glance
To bring it all together, here's a quick-reference table that breaks down these core metrics. Think of it as a cheat sheet for understanding the health of your drone program.
| Metric | What It Measures | Simple Calculation Formula | What It Reveals |
|---|---|---|---|
| Flight Hours | The utilization of aircraft and pilots. | Total time an asset or person is operational. | Identifies over/underused resources and potential burnout. |
| Cost Per Flight Hour | The true financial expense of operating a drone for one hour. | Total Operational Costs / Total Flight Hours | Pinpoints financial efficiency and helps calculate mission profitability. |
| Mission Success Rate | The reliability and quality of your operational output. | (Successful Missions / Total Missions) x 100 | Highlights issues in planning, training, or equipment reliability. |
Keeping a close eye on these three areas gives you a solid, quantifiable foundation. From here, you can start making smarter, data-backed decisions to steer your entire operation toward greater efficiency and profitability.
Keeping Your Fleet Mission-Ready with Health Metrics
A drone sitting on a workshop shelf isn't just gathering dust—it's losing you money. This simple truth is why some of the most important metrics in any operation are all about the health and readiness of your fleet. These aren't just flight performance numbers; they tell a much bigger story about how reliable, maintainable, and ultimately profitable your drones are over their entire lives.
Think of these metrics as your early warning system. They help you get out of the reactive, "fix-it-when-it-breaks" cycle and into a proactive strategy that keeps your drones in the air where they belong. Tracking the right health data is the key to making sure your assets are always ready to fly at a moment's notice.
Predicting Reliability with Mean Time Between Failures
One of the most powerful health metrics you can track is Mean Time Between Failures (MTBF). Don't let the technical-sounding name throw you; the concept is straightforward and absolutely essential for any serious drone program. MTBF is your crystal ball for predicting how long a specific drone model will operate before something significant goes wrong.
To figure it out, you take the total operational hours for a certain drone type and divide it by the number of breakdowns it had in that same period. A high MTBF is fantastic—it means you've got a real workhorse on your hands. But a low MTBF? That's a major red flag, telling you that a particular asset might be costing you more in downtime than it's worth.
This graphic gives a great visual of the relationship between failure rate and time, which is the whole idea behind MTBF.
This "bathtub curve" shows that failures are more common right at the beginning of a drone's life ("infant mortality") and again towards the end ("wear-out"). That long, flat bottom of the curve is the drone's useful life, and that's the period MTBF helps you manage effectively.
By keeping an eye on MTBF, you can start scheduling preventative maintenance with real intelligence. You can service a component before it fails, avoiding a mission-scrubbing breakdown in the field that costs you both time and money.
Quantifying Downtime and Repair Speed
While MTBF helps predict when a failure might happen, other metrics measure the real-world impact when one actually does.
-
Maintenance Downtime Percentage: This number shows you exactly what percentage of time your drone is grounded for repairs versus being ready for a mission. A high percentage here is a direct hit to your bottom line, signaling that an asset is spending way too much time in the workshop.
-
Average Repair Time (ART): Simply put, how long does it take your team to fix a problem and get that drone back in the air? Tracking ART is a fantastic way to spot recurring technical problems, identify where your technicians might need more training, or figure out if you need to optimize your spare parts inventory. Every minute you shave off this number is a minute more your fleet is available.
When you bring all these health metrics together, you get a complete picture of your asset reliability. You can pinpoint your most dependable drone models, make your maintenance workflow more efficient, and make data-backed decisions on whether to repair an older drone or if it's just more cost-effective to replace it. This is how you maximize the return on every piece of hardware you own.
From Data Capture to Client Delivery

Getting the drone back on the ground safely is a great feeling, but it’s really only half the battle. The true value you deliver to a client comes from turning all that raw data into a finished, usable product—and doing it quickly and efficiently.
This is where the focus shifts from the field to the office. We’re no longer talking about flight times, but about the entire data pipeline that transforms raw images and sensor readings into actionable insights. Nailing this post-flight workflow is absolutely critical for keeping clients happy and scaling your business without running your margins into the ground.
Measuring Your Data Turnaround Time
The first, and arguably most important, metric to track here is your Data Turnaround Time. This is the total clock time from the moment a drone lands to the second your client receives their final deliverable. Think of it as your core promise to the client; in a competitive market, speed is a massive advantage.
If this number starts creeping up, it’s a red flag that you have a bottleneck somewhere. Are you losing hours just downloading massive files from SD cards? Is the processing itself bogging down your machines for days? Squeezing this timeframe not only makes for happier customers but, just as crucially, it frees up your team to get started on the next paying project.
Tracking and reducing your Data Turnaround Time isn't just about moving faster; it's about boosting your entire operation's capacity. Every hour you save is another hour you can put toward revenue-generating work.
Calculating Your Data Processing Cost Per Project
While time is a huge factor, you can’t ignore the hard costs. Your Data Processing Cost per Project tells you exactly how much money it takes to get from raw data to a polished product. Without this number, you’re just guessing at your pricing and hoping you’re profitable.
To figure this out, you’ll need to add up a few key expenses:
- Software Licenses: The monthly or annual fees for your specialized photogrammetry or analytics software.
- Cloud Computing and Storage: Any costs for cloud-based processing power or data hosting services.
- Analyst Hours: The wages for the team members who are processing, analyzing, and running quality checks on the data.
This constant push for efficiency is changing how businesses operate. In fact, by 2025, many companies will be leaning heavily on automation for these kinds of repetitive data tasks. This is made easier by a new wave of low-code tools that slash manual effort and the risk of human error. Getting on board with these tools can make your data workflow faster, more consistent, and ready to scale. You can find more insights on streamlining operations over at sdocs.com.
In the world of aviation, elite efficiency is built on a foundation of world-class safety. The two are inseparable. Top-tier drone programs get this. They understand operational excellence isn’t just about speed and cost; it’s about weaving safety and compliance into the very fabric of every flight.
This commitment is what separates the professionals from the amateurs. A stellar safety record is more than just a box to tick for regulators—it’s a powerful business asset. It builds client trust, can help lower your insurance premiums, and fiercely protects your brand's reputation. But you can't just say you're safe; you have to prove it with data.
Tracking Safety Incidents and Compliance Rates
Two operational efficiency metrics are absolutely essential for proving that commitment. The first is your Safety Incidents per 1000 Flight Hours. This is the industry-standard benchmark, giving you a clear, measurable look at your program's safety performance over time. A low, and consistently decreasing, rate is hard evidence that your safety protocols are working.
The second metric is your Compliance Adherence Rate. This one is all about discipline. It measures how rigorously your team follows critical pre-flight checklists, airspace checks, and regulatory protocols for every single mission. Aiming for a high adherence rate, like 99% or better, shows your pilots are disciplined and that your standard operating procedures are second nature.
Tracking compliance isn't about micromanagement. It's about building a system where the safe choice is the easy choice. It proves your team consistently does the right things, even when no one is watching.
Think about it this way: a high compliance rate has a direct, positive impact on your mission success rate. When pilots meticulously follow their checklists, they catch potential problems—like an uncalibrated sensor or a low battery—while they're still on the ground, not in the air.
This proactive mindset is a cornerstone of effective drone risk management, preventing small oversights from snowballing into costly mission failures or, worse, serious safety incidents. When you link these metrics, you can draw a straight line from a strong safety culture directly to better operational performance and reliability.
Turning Your Metrics into Smarter Decisions
Collecting data is one thing. But using it to drive meaningful action? That's where true operational excellence is born.
Your spreadsheets full of numbers are only valuable when they help you make intelligent, forward-looking decisions for your drone program. It's all about learning to see the story behind the numbers and turning those insights into a clear plan.
The trick is to know the difference between data that tells you what happened and data that helps you predict what will happen. Getting this right is how you shift from a reactive mode to a truly proactive strategy.
Leading vs. Lagging Indicators
A great way to start is by splitting your metrics into two camps. This simple step can completely change how you make decisions.
- Lagging Indicators are your rearview mirror. They measure past performance, like last quarter’s total repair costs or the mission success rate from your last big project. They’re great for confirming results, but they don't predict what’s coming.
- Leading Indicators are your crystal ball. They're forward-looking and can signal future outcomes. For instance, a steady increase in component failures on a specific drone model is a leading indicator that could predict a major, mission-critical failure down the road.
By focusing on leading indicators, you can get ahead of potential problems before they ever hit your bottom line. It's the difference between constantly fixing things and preventing them from breaking in the first place.
One powerful way to turn your metrics into a concrete improvement plan is by conducting a value chain analysis. This helps you map out and optimize your entire operation, from start to finish.
Building a Framework for Action
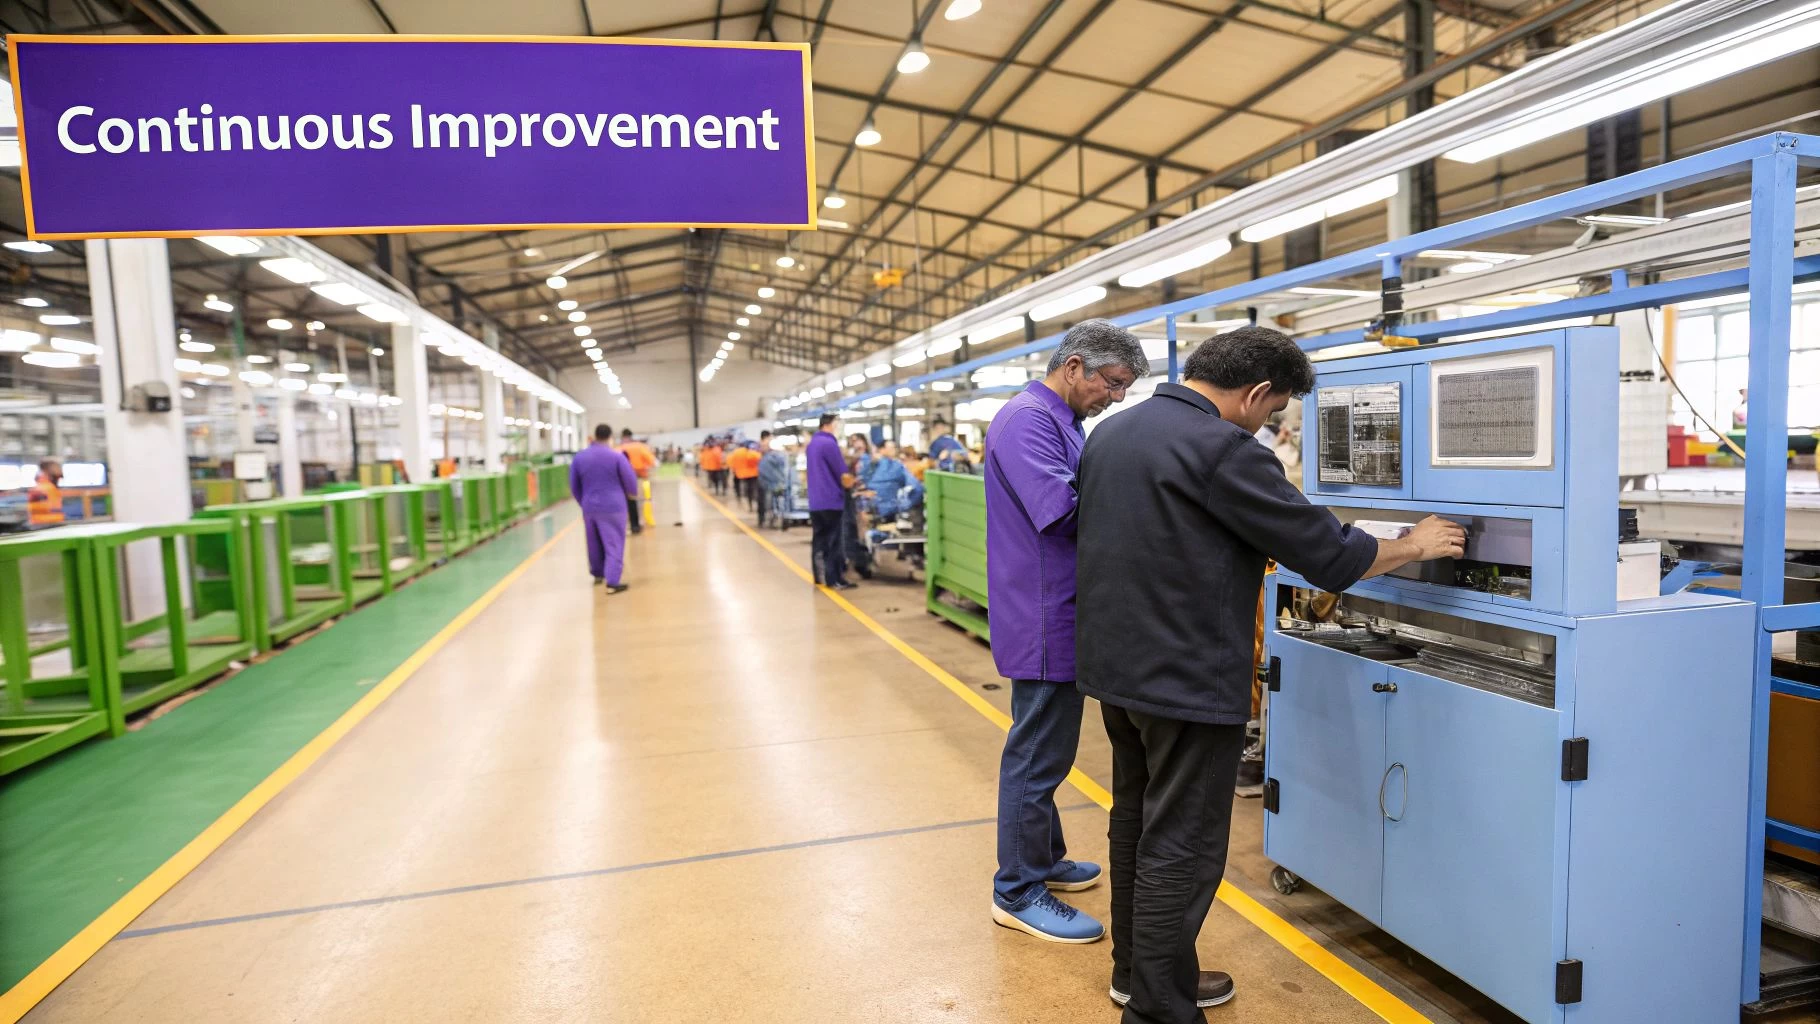
Once you have your metrics sorted, you can build a simple but powerful framework for continuous improvement.
Let's say you see a recent spike in your Maintenance Downtime Percentage (a lagging indicator). You can use that hard data to build a solid business case for investing in newer, more reliable drones. It allows you to confidently show stakeholders how the upfront cost will be more than offset by future savings in lost flight hours and repair bills.
This concept isn't limited to just drones, of course. For example, a manufacturer might see rising production numbers as a leading indicator for hitting future goals. On the flip side, poor customer feedback from the last quarter serves as a lagging indicator that their quality control needs a serious look.
The key is to pick the right mix of metrics that align with your specific goals. By setting realistic benchmarks and zeroing in on your biggest opportunities, you can use data to confidently demonstrate the ROI of your drone program.
For a deeper dive into practical steps, check out our full guide on https://blog.dronedesk.io/how-to-improve-operational-efficiency/ in your drone business.
Got Questions? We've Got Answers
Knowing the theory is one thing, but putting these metrics to work in the real world is where the rubber really meets the road. Let's tackle some of the most common questions drone program managers have when they start digging into their operational data.
What's the Best Metric to Start Tracking?
If you're only going to track one thing, make it Cost per Flight Hour. Seriously. It’s the one metric that forces you to get a real grip on all your expenses, from the obvious stuff like maintenance to the less obvious like software subscriptions and pilot salaries.
This single number gives you a powerful financial baseline. Once you know your true cost to operate, you can price your services with confidence, figure out if a job was actually profitable, and make smart calls on which drones are giving you the best bang for your buck.
Starting with Cost per Flight Hour instantly changes your mindset. You stop just flying missions and start running a proper business. It’s the foundation all your other performance data will build on.
Is There Software to Automate This Stuff?
Yes, and you should absolutely use it. Trying to keep track of everything in spreadsheets is a fast track to burnout and costly mistakes. Modern drone operations management software is built to handle this for you.
Platforms like Dronedesk pull critical data right from your flight logs automatically. This includes things like:
- Flight duration for both your pilots and your aircraft
- Maintenance schedules and logged downtime
- Mission details and associated client info
Automating this means your data is always accurate and up-to-date. It frees up your team to focus on flying and talking to clients instead of getting bogged down in tedious admin. The whole point is to make tracking your efficiency a seamless part of your daily grind, not another chore.
How Often Should I Be Looking at My Metrics?
There's no single right answer, as it depends on how busy you are. But a good rule of thumb is to set up a tiered review schedule.
- Weekly: Check your leading indicators. This is stuff like upcoming maintenance dates or how close a pilot is to their flight hour limit. It’s about spotting potential problems before they happen.
- Monthly: Dig into your core performance metrics like Cost per Flight Hour and Mission Success Rate. This is where you’ll spot short-term trends and see how you’re tracking against your goals for the month.
- Quarterly: Look at the bigger picture. This is the time to assess lagging indicators like client satisfaction and overall business profitability. These insights will help you make larger, strategic shifts in your business.
This kind of structured review ensures you're always keeping a finger on the pulse of your operations. It turns your data from a bunch of numbers into timely decisions that actually improve your bottom line.
Ready to stop guessing and start measuring? Dronedesk is the all-in-one platform that automates your data collection, simplifies compliance, and gives you the critical operational metrics you need to scale your drone business profitably. Learn how Dronedesk can transform your operations today.
 What a BVLOS Flight Means for Risk and Compliance →
 Drone VLOS Rules Explained for Commercial Teams →
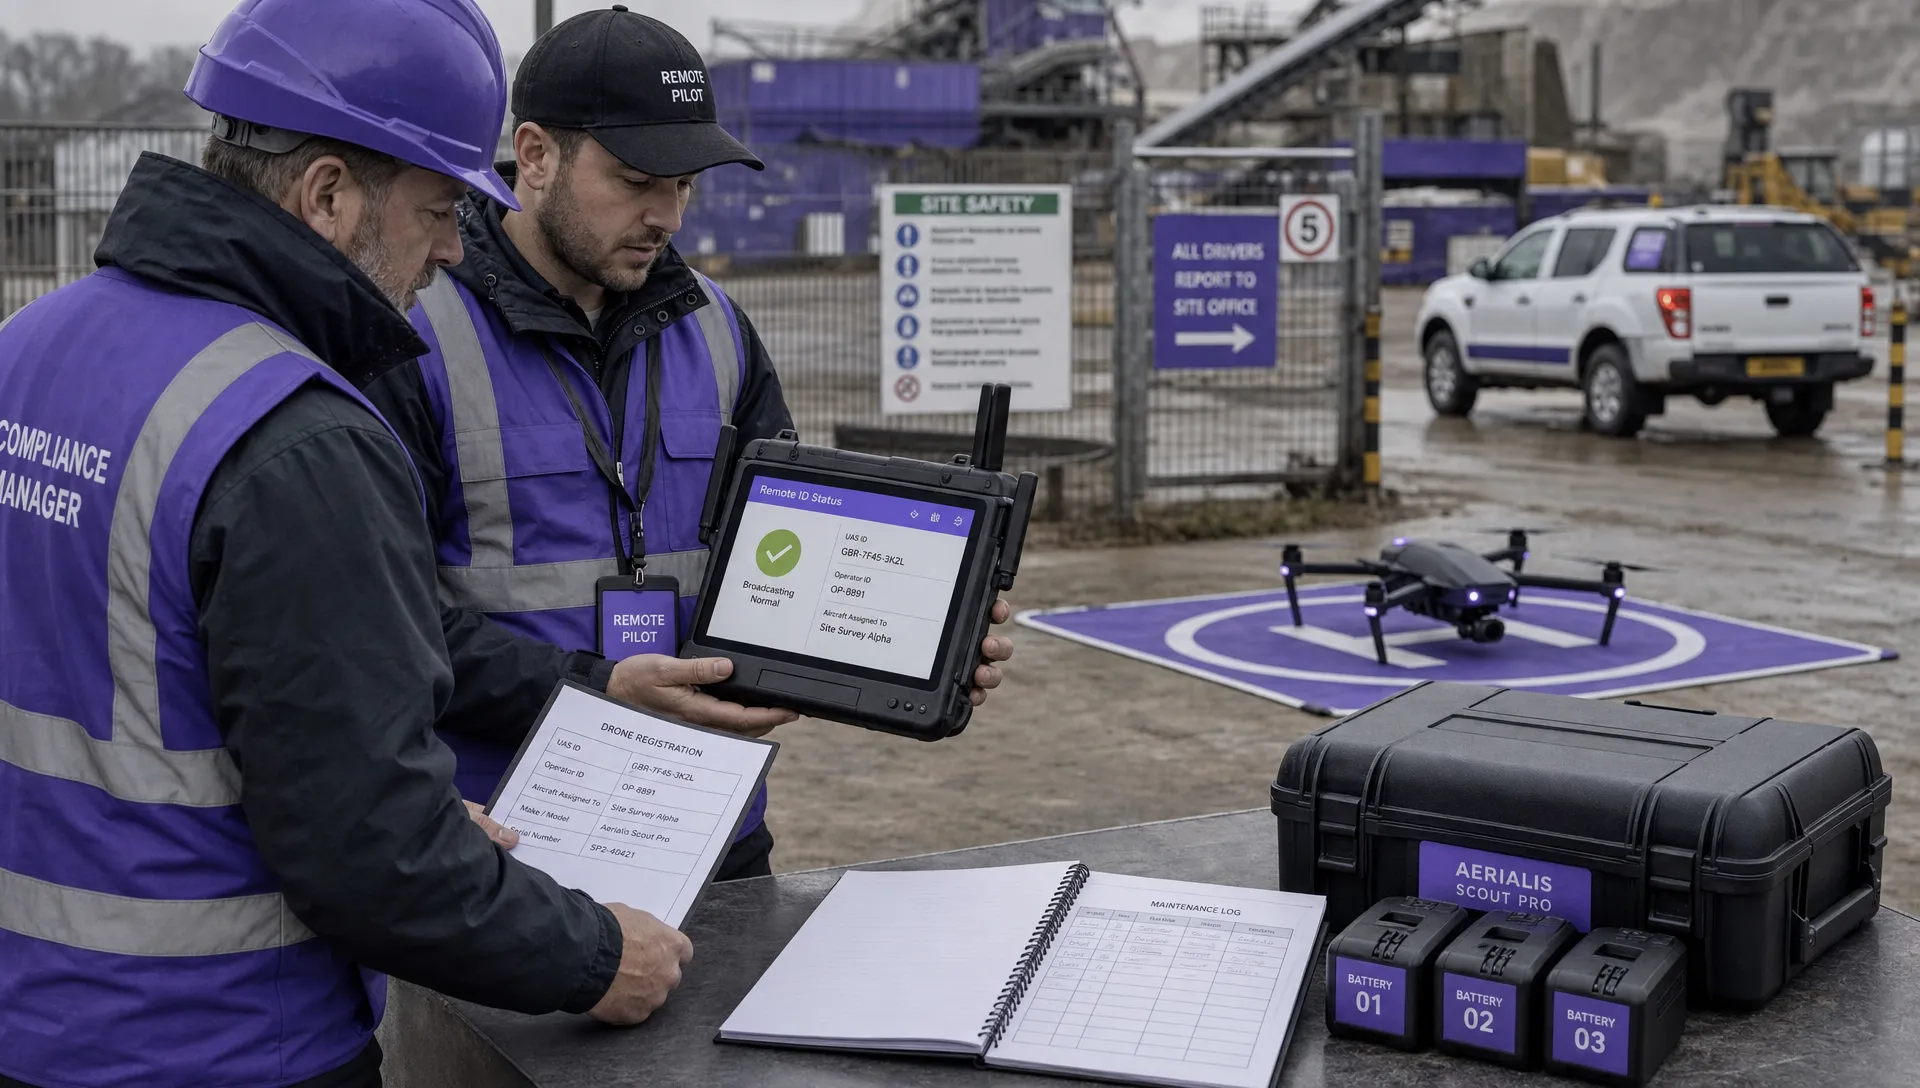 FAA Remote ID Rule Explained for Commercial Pilots →
 Drone Legal Requirements for Commercial Operations →
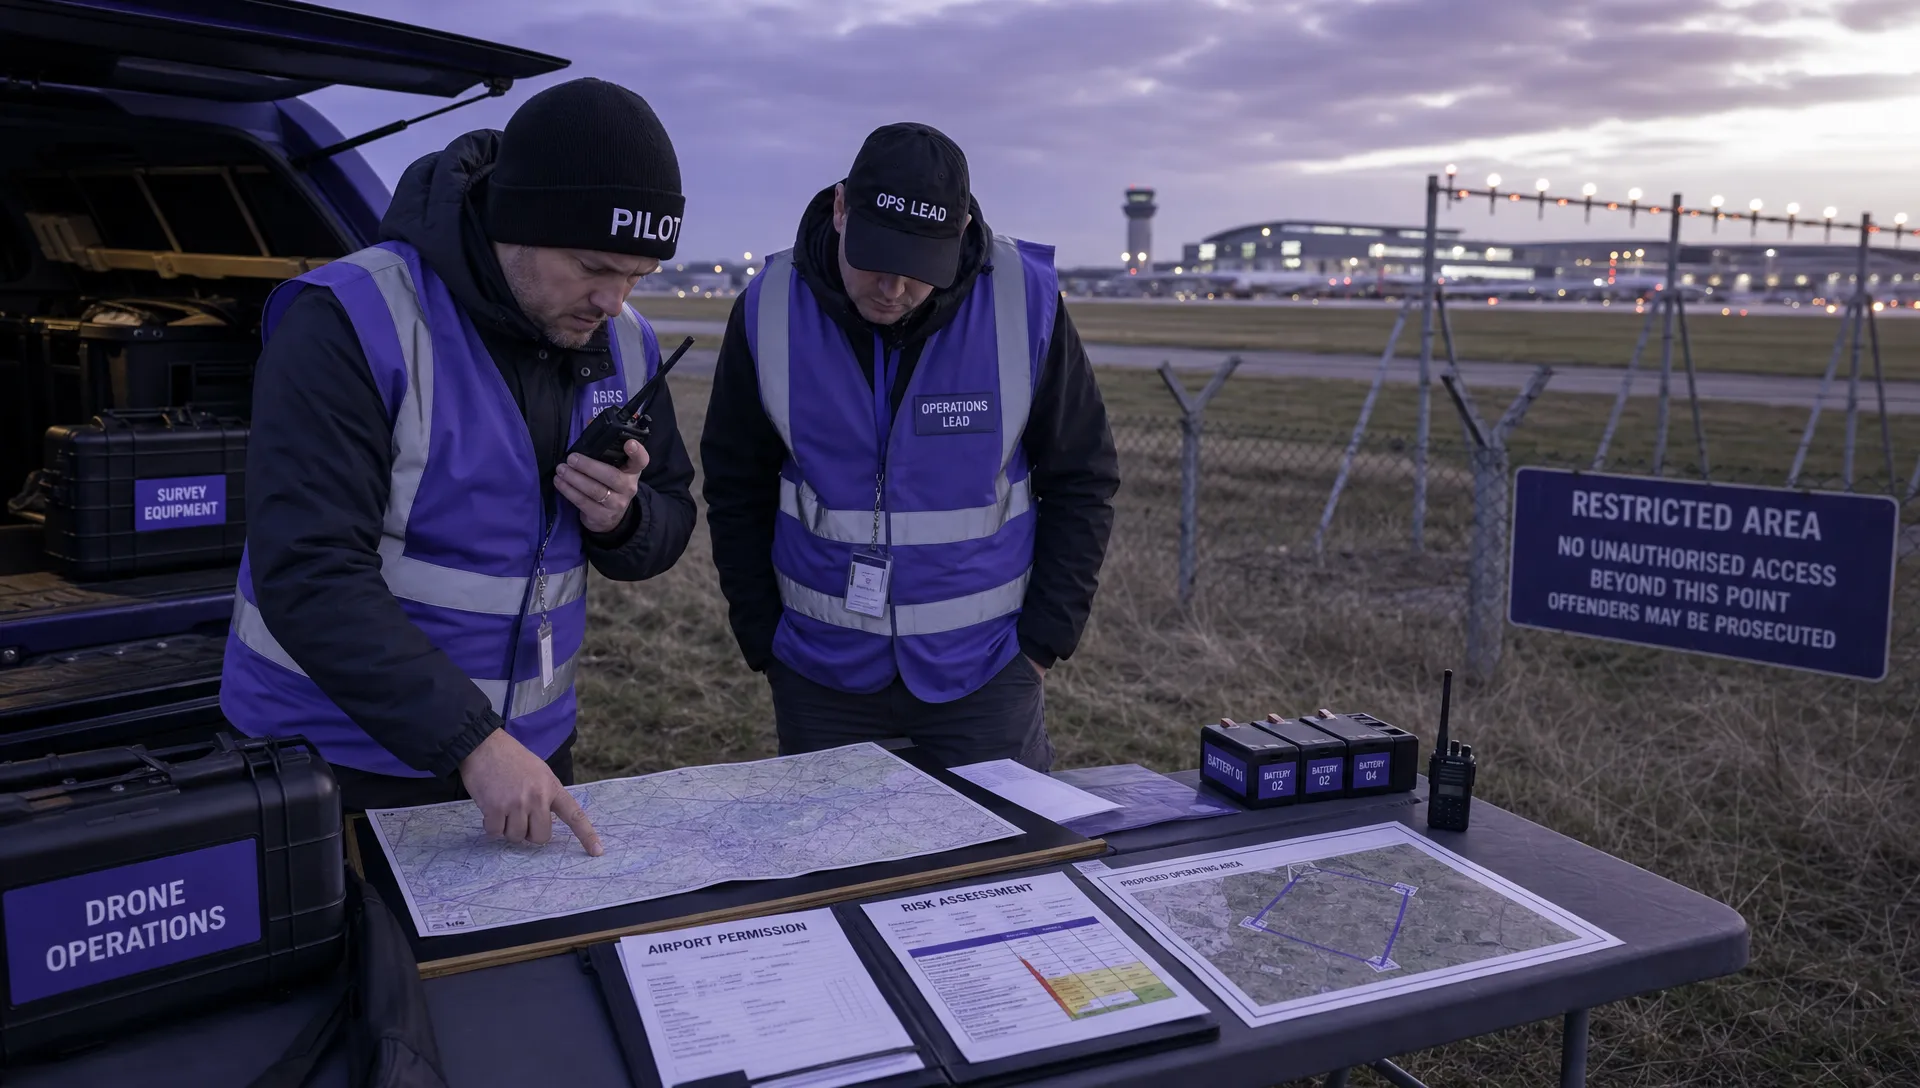 Drone Near Airport Rules Explained for Safer Planning →
 International Drone Regulations Every Global Team Should Know →
 Drone Flight Risk Assessment Example for Safer Missions →
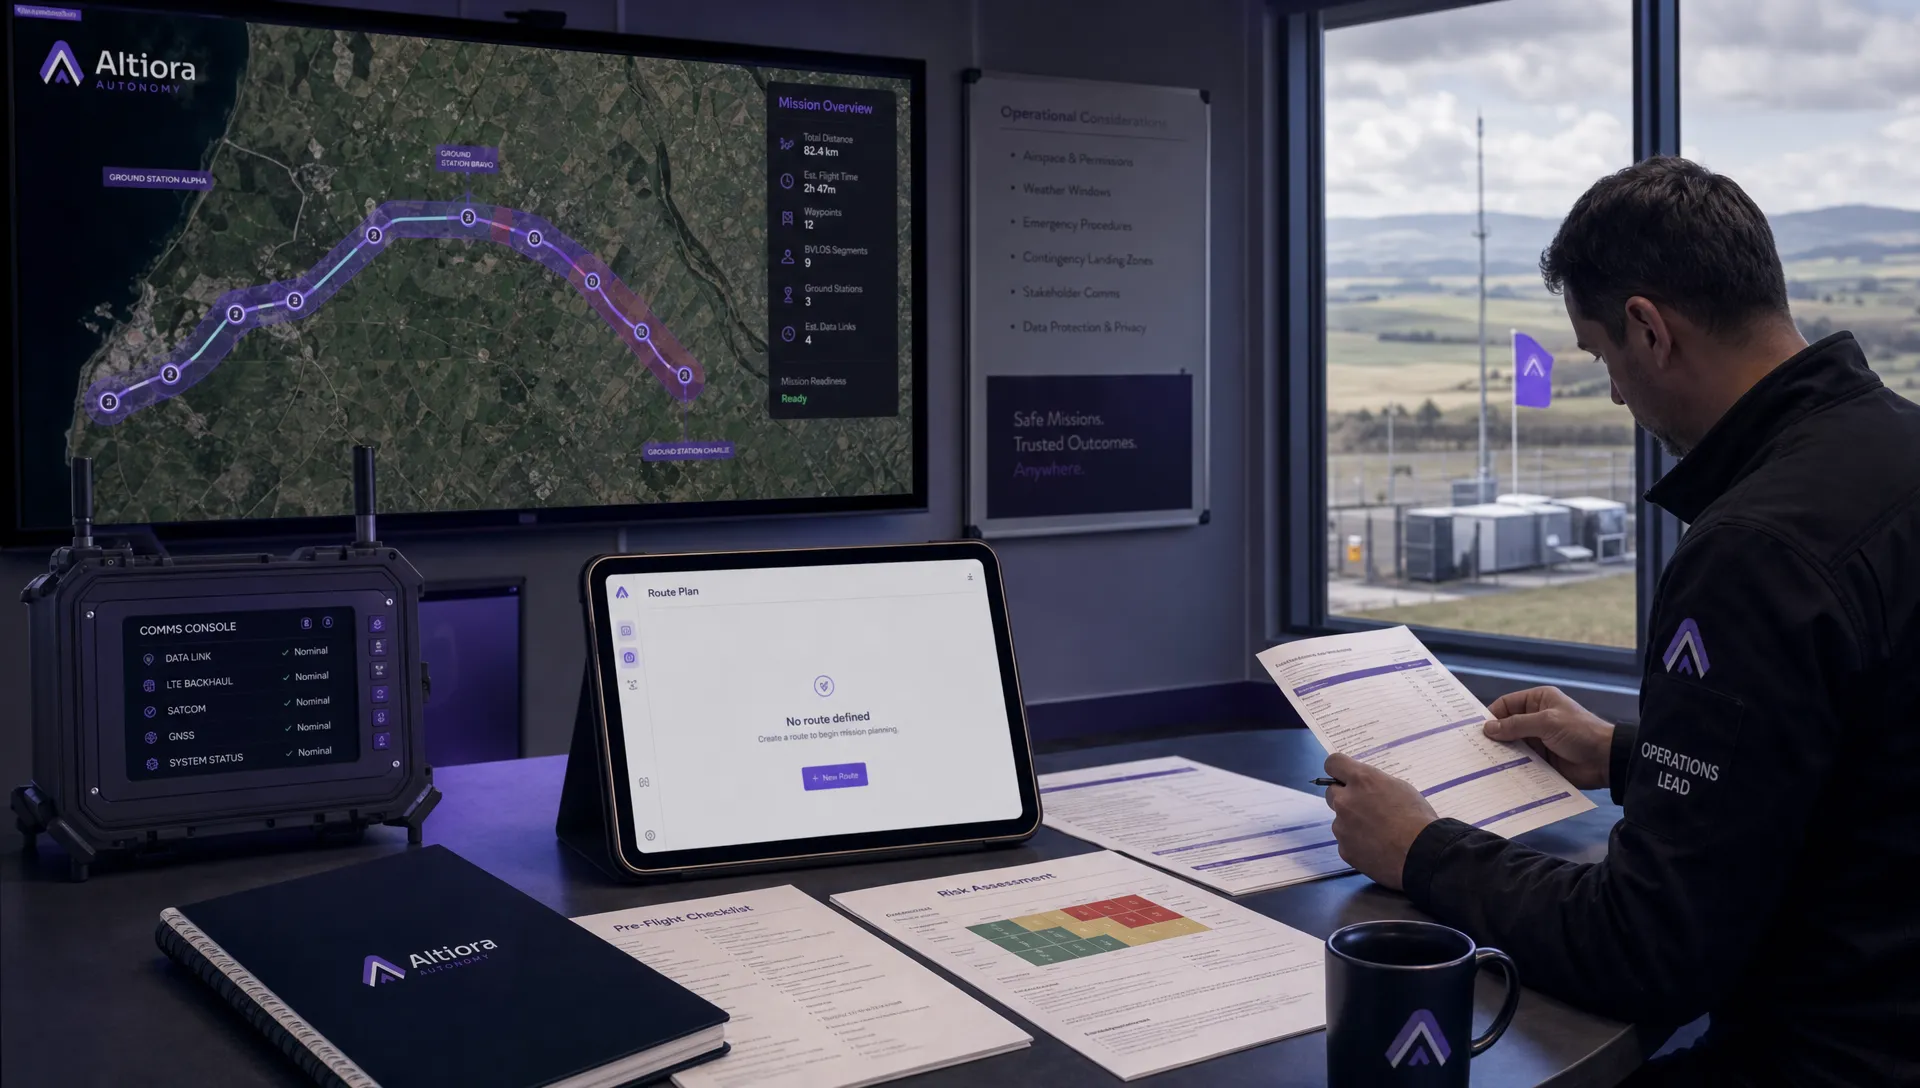 Beyond Visual Line of Sight Explained for Operators →
 How BVLOS Drone Operations Change Commercial Workflows →
 FAA Drone Rules Every Commercial Pilot Should Know →